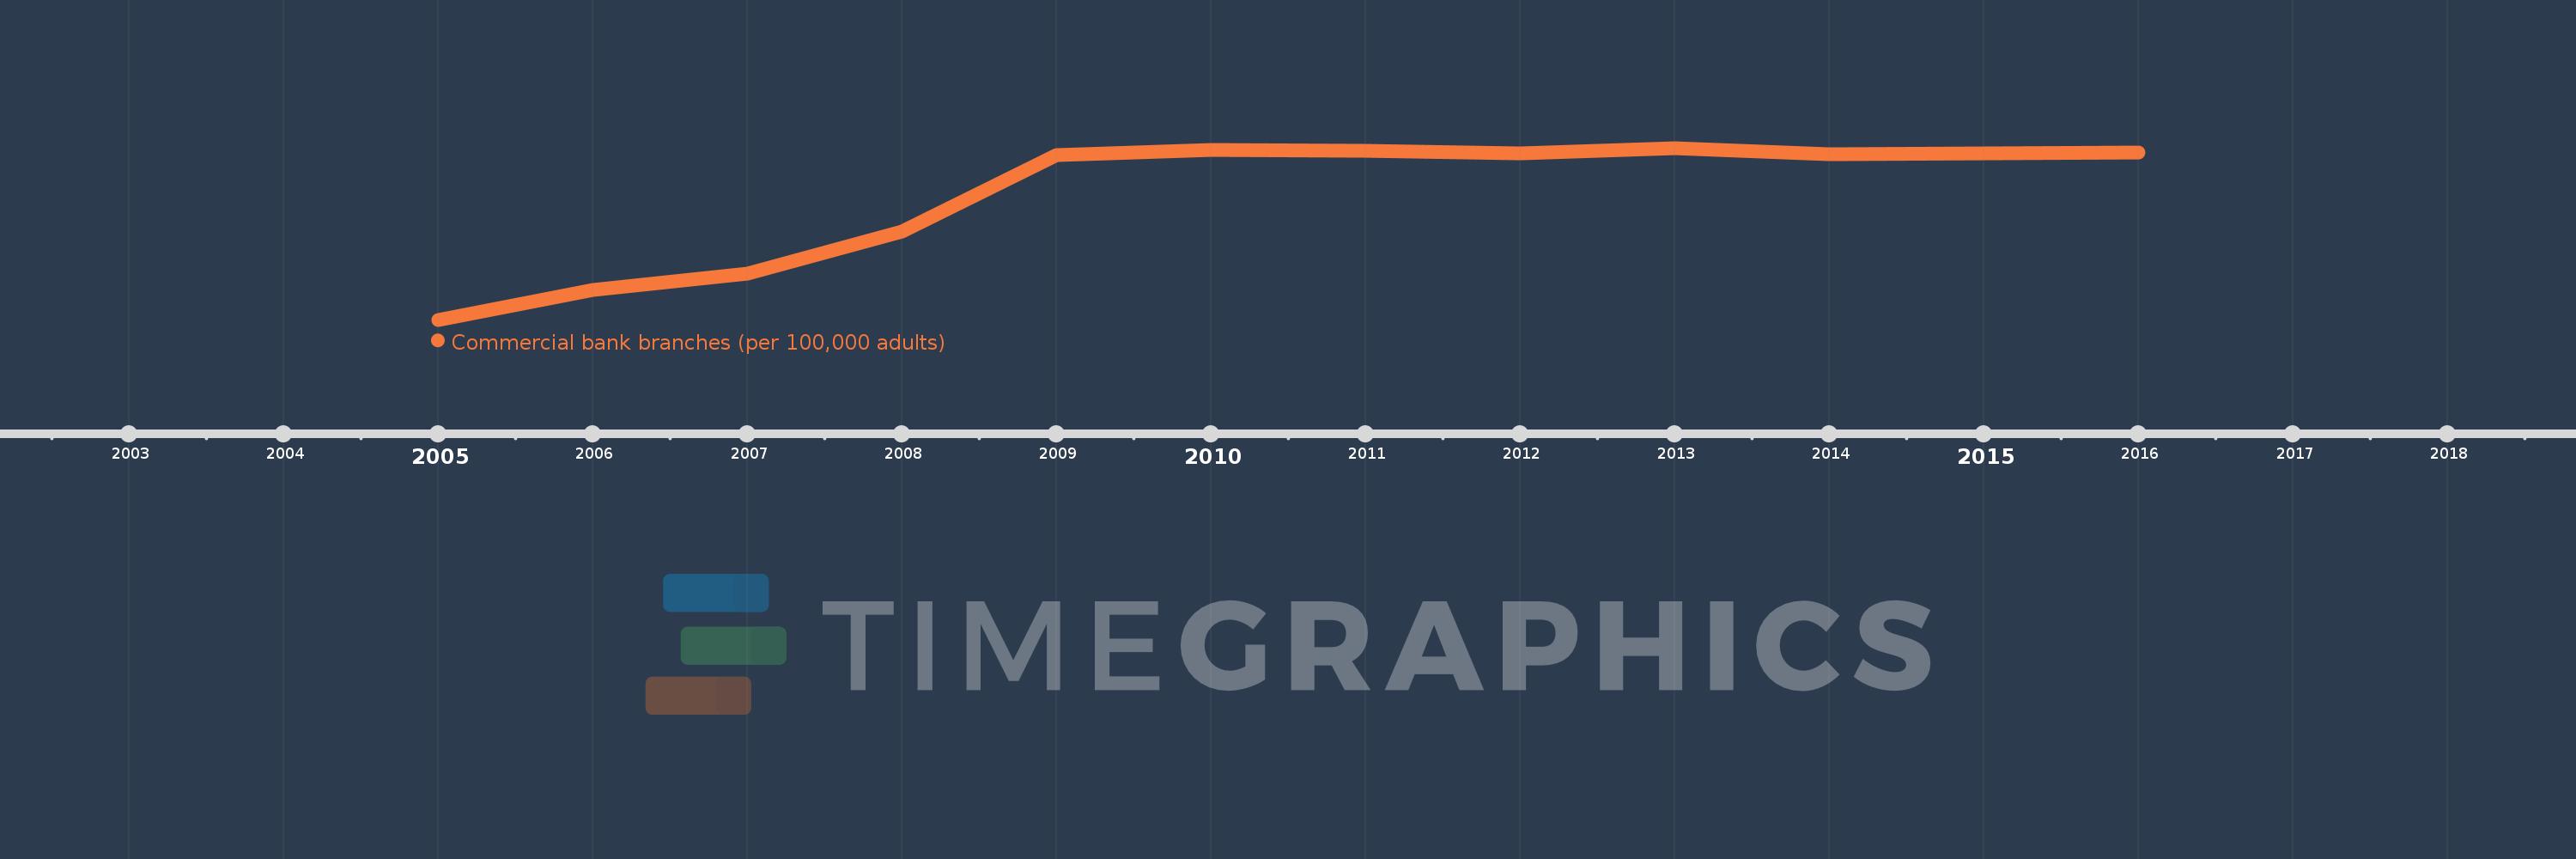
This timeline shows a graph from 2005 to 2016 of Europe & Central Asia (IDA & IBRD countries). No data until 2004. Number of actual observations by date: 12.
Source name:
World Development Indicators
Source organization:
International Monetary Fund, Financial Access Survey.
Categories, topics:
Financial Sector
Last updated:
apr 23, 2017
Indicators value changes by year
Meaning:
20.177
Minimum:
10.231
jan 1, 2005
Maximum:
23.856
jan 1, 2013
At the date of observation
Value
Absolute change
Change from the previous value
jan 1, 2005
10.231
+10.231
0.0%
jan 1, 2006
12.593
+2.362
23.09%
jan 1, 2007
13.918
+1.325
10.52%
jan 1, 2008
17.224
+3.305
23.75%
jan 1, 2009
23.289
+6.065
35.22%
jan 1, 2010
23.73
+0.441
1.89%
jan 1, 2011
23.611
-0.119
-0.5%
jan 1, 2012
23.409
-0.201
-0.85%
jan 1, 2013
23.856
+0.447
1.91%
jan 1, 2014
23.338
-0.518
-2.17%
jan 1, 2015
23.45
+0.111
0.48%
jan 1, 2016
23.474
+0.024
0.1%
Ranking of countries by current statistics by years