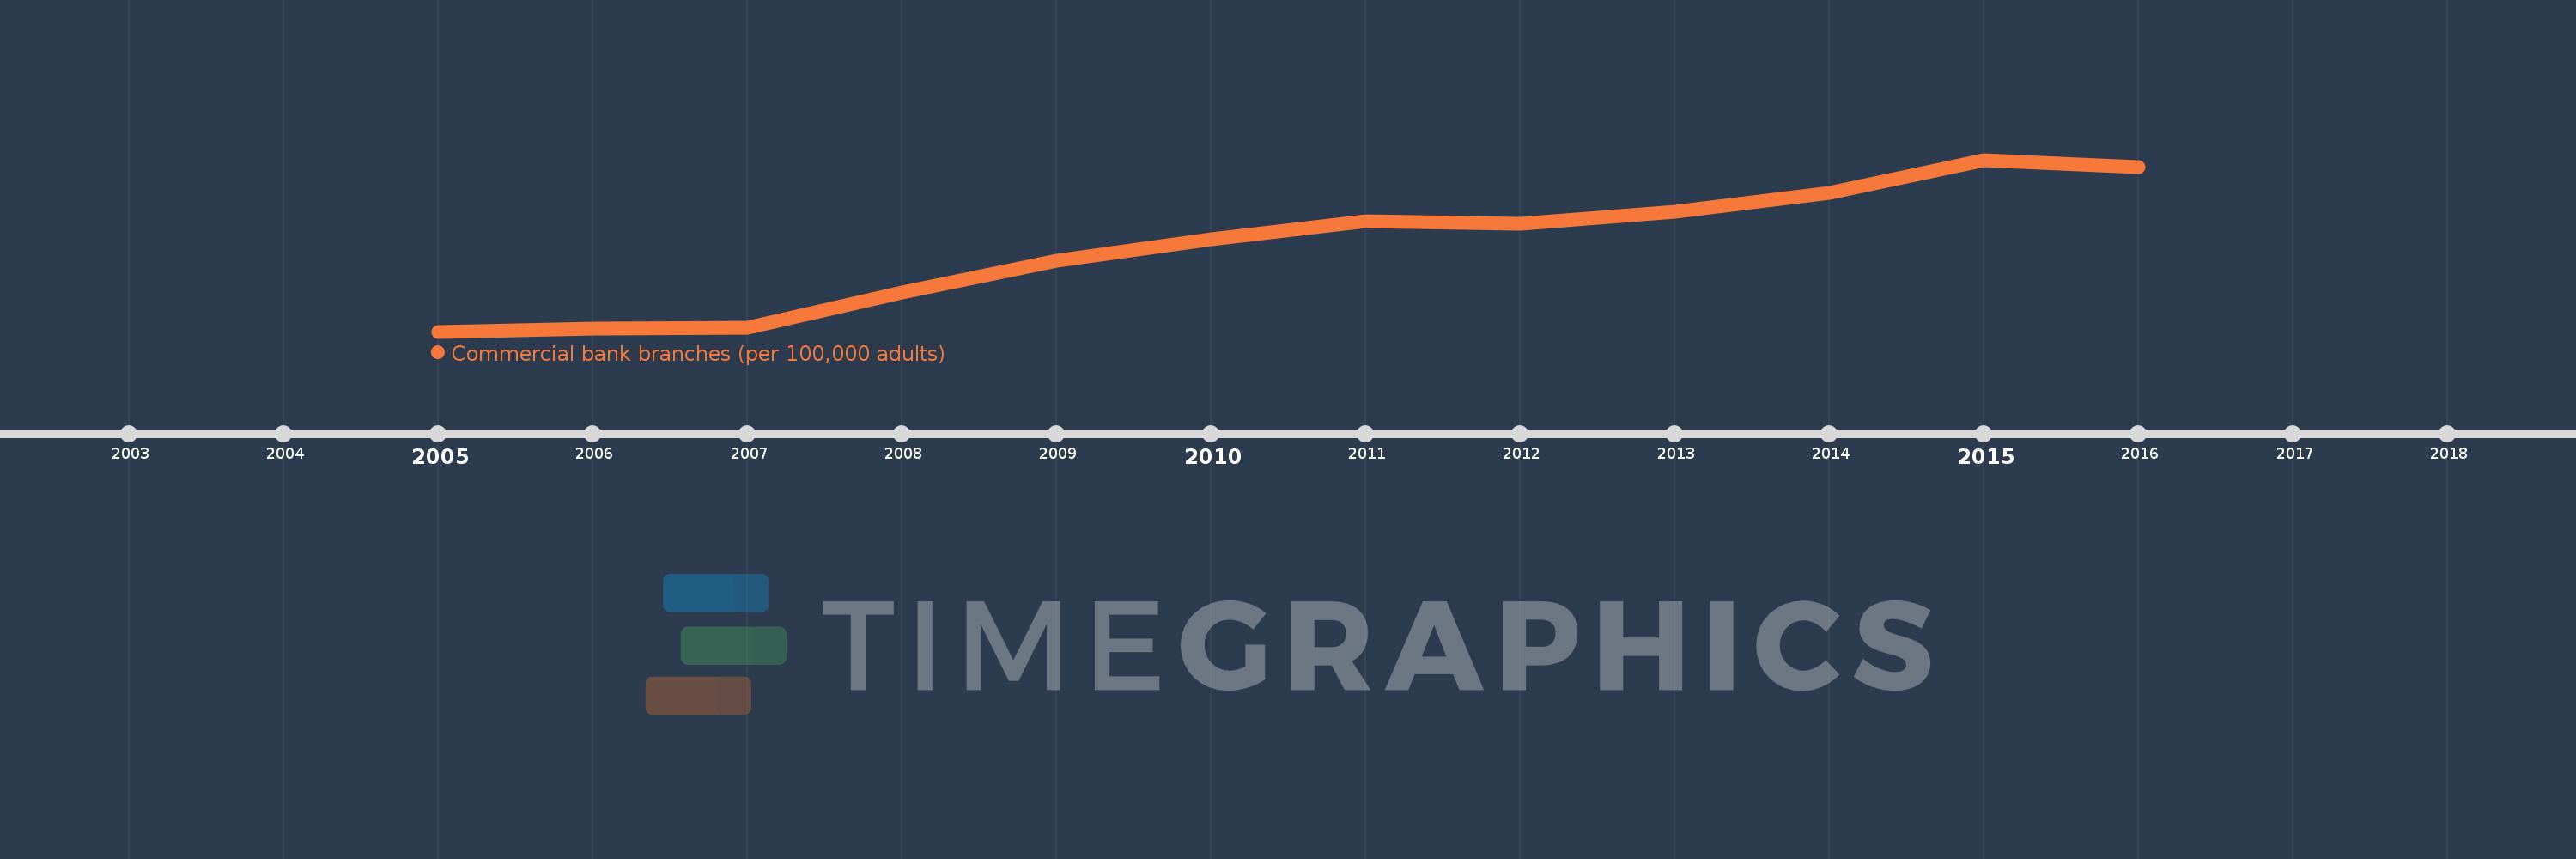
This timeline shows a graph from 2005 to 2016 of Heavily indebted poor countries (HIPC). No data until 2004. Number of actual observations by date: 12.
Source name:
World Development Indicators
Source organization:
International Monetary Fund, Financial Access Survey.
Categories, topics:
Financial Sector
Last updated:
apr 23, 2017
Indicators value changes by year
Meaning:
2.435
Minimum:
1.164
jan 1, 2005
Maximum:
3.726
jan 1, 2015
At the date of observation
Value
Absolute change
Change from the previous value
jan 1, 2005
1.164
+1.164
0.0%
jan 1, 2006
1.208
+0.044
3.78%
jan 1, 2007
1.217
+0.008
0.69%
jan 1, 2008
1.741
+0.524
43.09%
jan 1, 2009
2.225
+0.485
27.85%
jan 1, 2010
2.544
+0.319
14.33%
jan 1, 2011
2.816
+0.271
10.66%
jan 1, 2012
2.769
-0.046
-1.65%
jan 1, 2013
2.951
+0.182
6.56%
jan 1, 2014
3.237
+0.286
9.68%
jan 1, 2015
3.726
+0.489
15.1%
jan 1, 2016
3.622
-0.103
-2.77%
Ranking of countries by current statistics by years