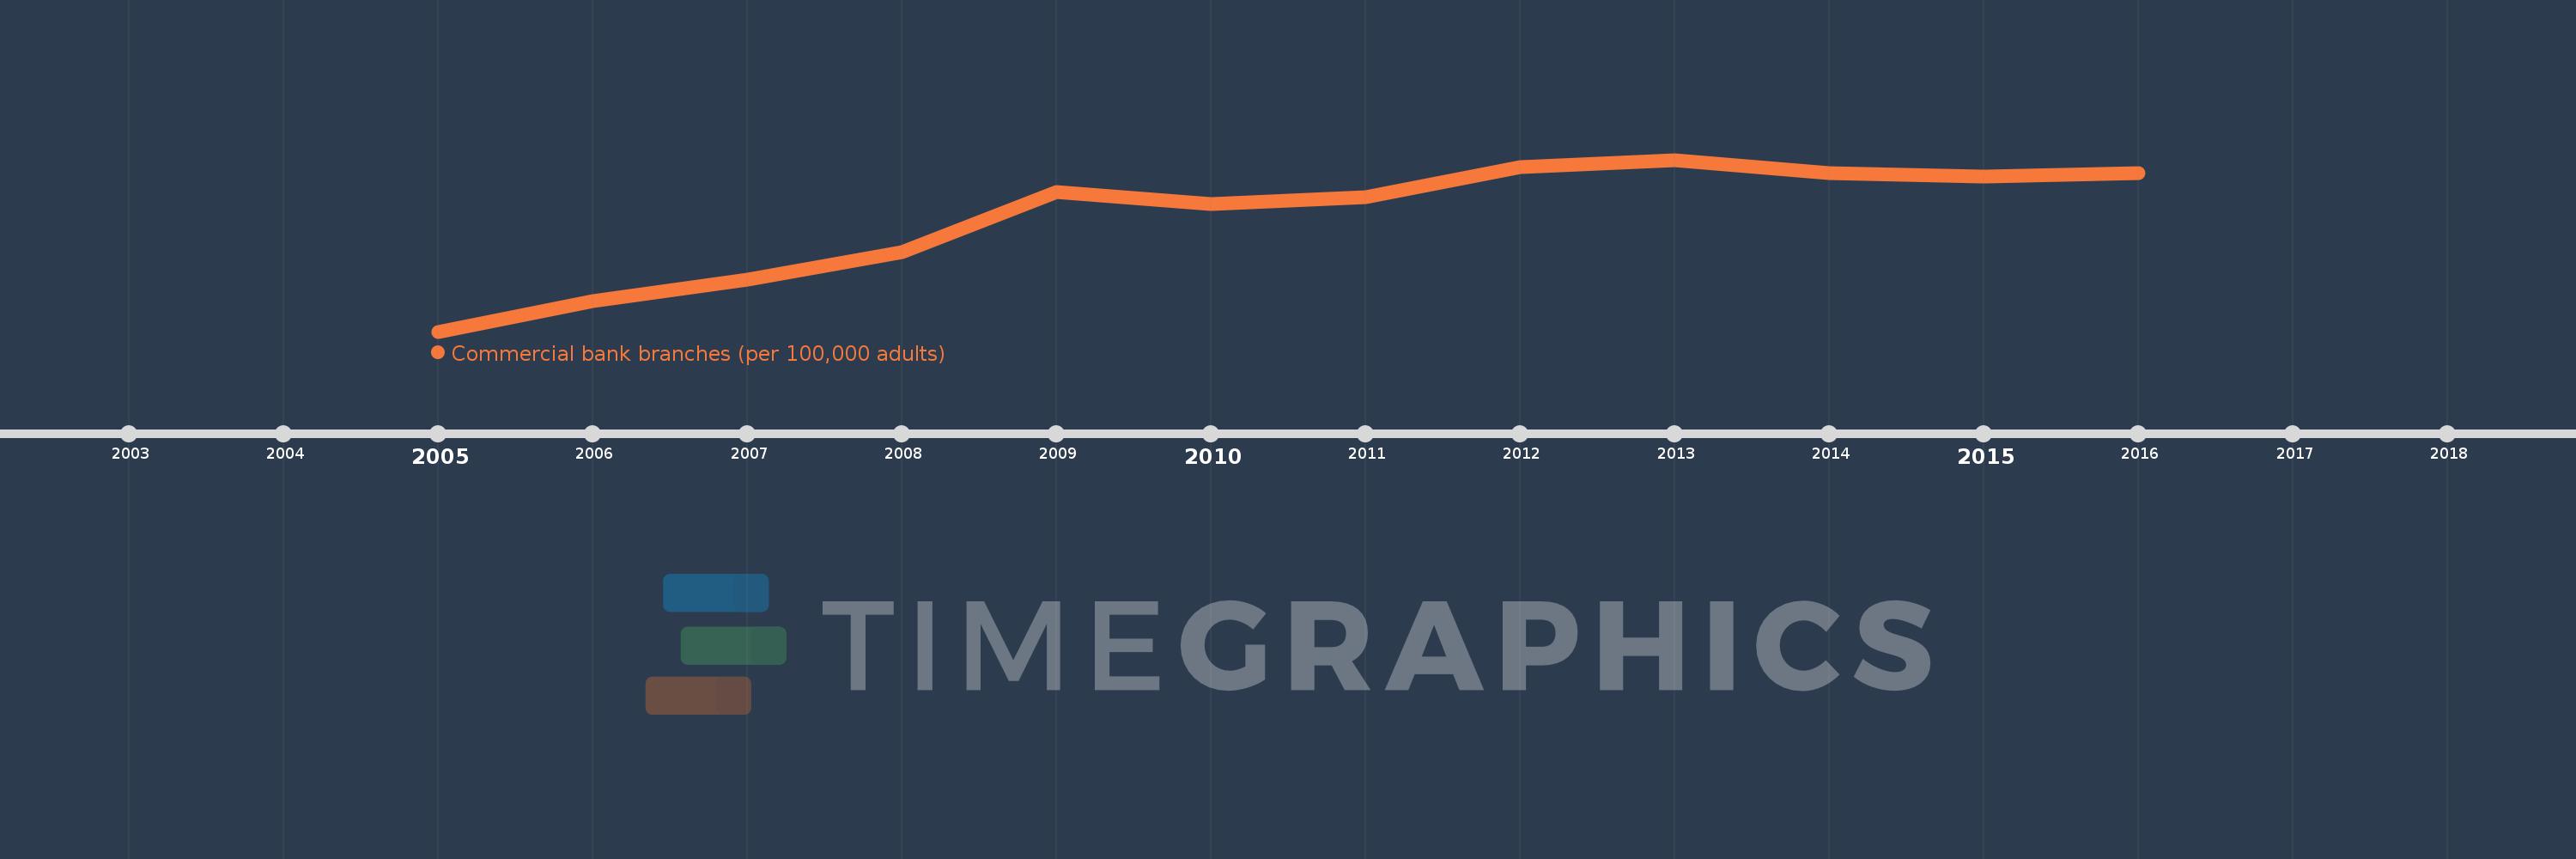
This timeline shows a graph from 2005 to 2016 of Europe & Central Asia (excluding high income). No data until 2004. Number of actual observations by date: 12.
Source name:
World Development Indicators
Source organization:
International Monetary Fund, Financial Access Survey.
Categories, topics:
Financial Sector
Last updated:
apr 23, 2017
Indicators value changes by year
Meaning:
18.592
Minimum:
9.523
jan 1, 2005
Maximum:
23.15
jan 1, 2013
At the date of observation
Value
Absolute change
Change from the previous value
jan 1, 2005
9.523
+9.523
0.0%
jan 1, 2006
11.95
+2.427
25.48%
jan 1, 2007
13.676
+1.726
14.45%
jan 1, 2008
15.813
+2.137
15.63%
jan 1, 2009
20.6
+4.787
30.27%
jan 1, 2010
19.632
-0.968
-4.7%
jan 1, 2011
20.205
+0.573
2.92%
jan 1, 2012
22.574
+2.369
11.73%
jan 1, 2013
23.15
+0.575
2.55%
jan 1, 2014
22.096
-1.054
-4.55%
jan 1, 2015
21.815
-0.281
-1.27%
jan 1, 2016
22.068
+0.253
1.16%
Ranking of countries by current statistics by years