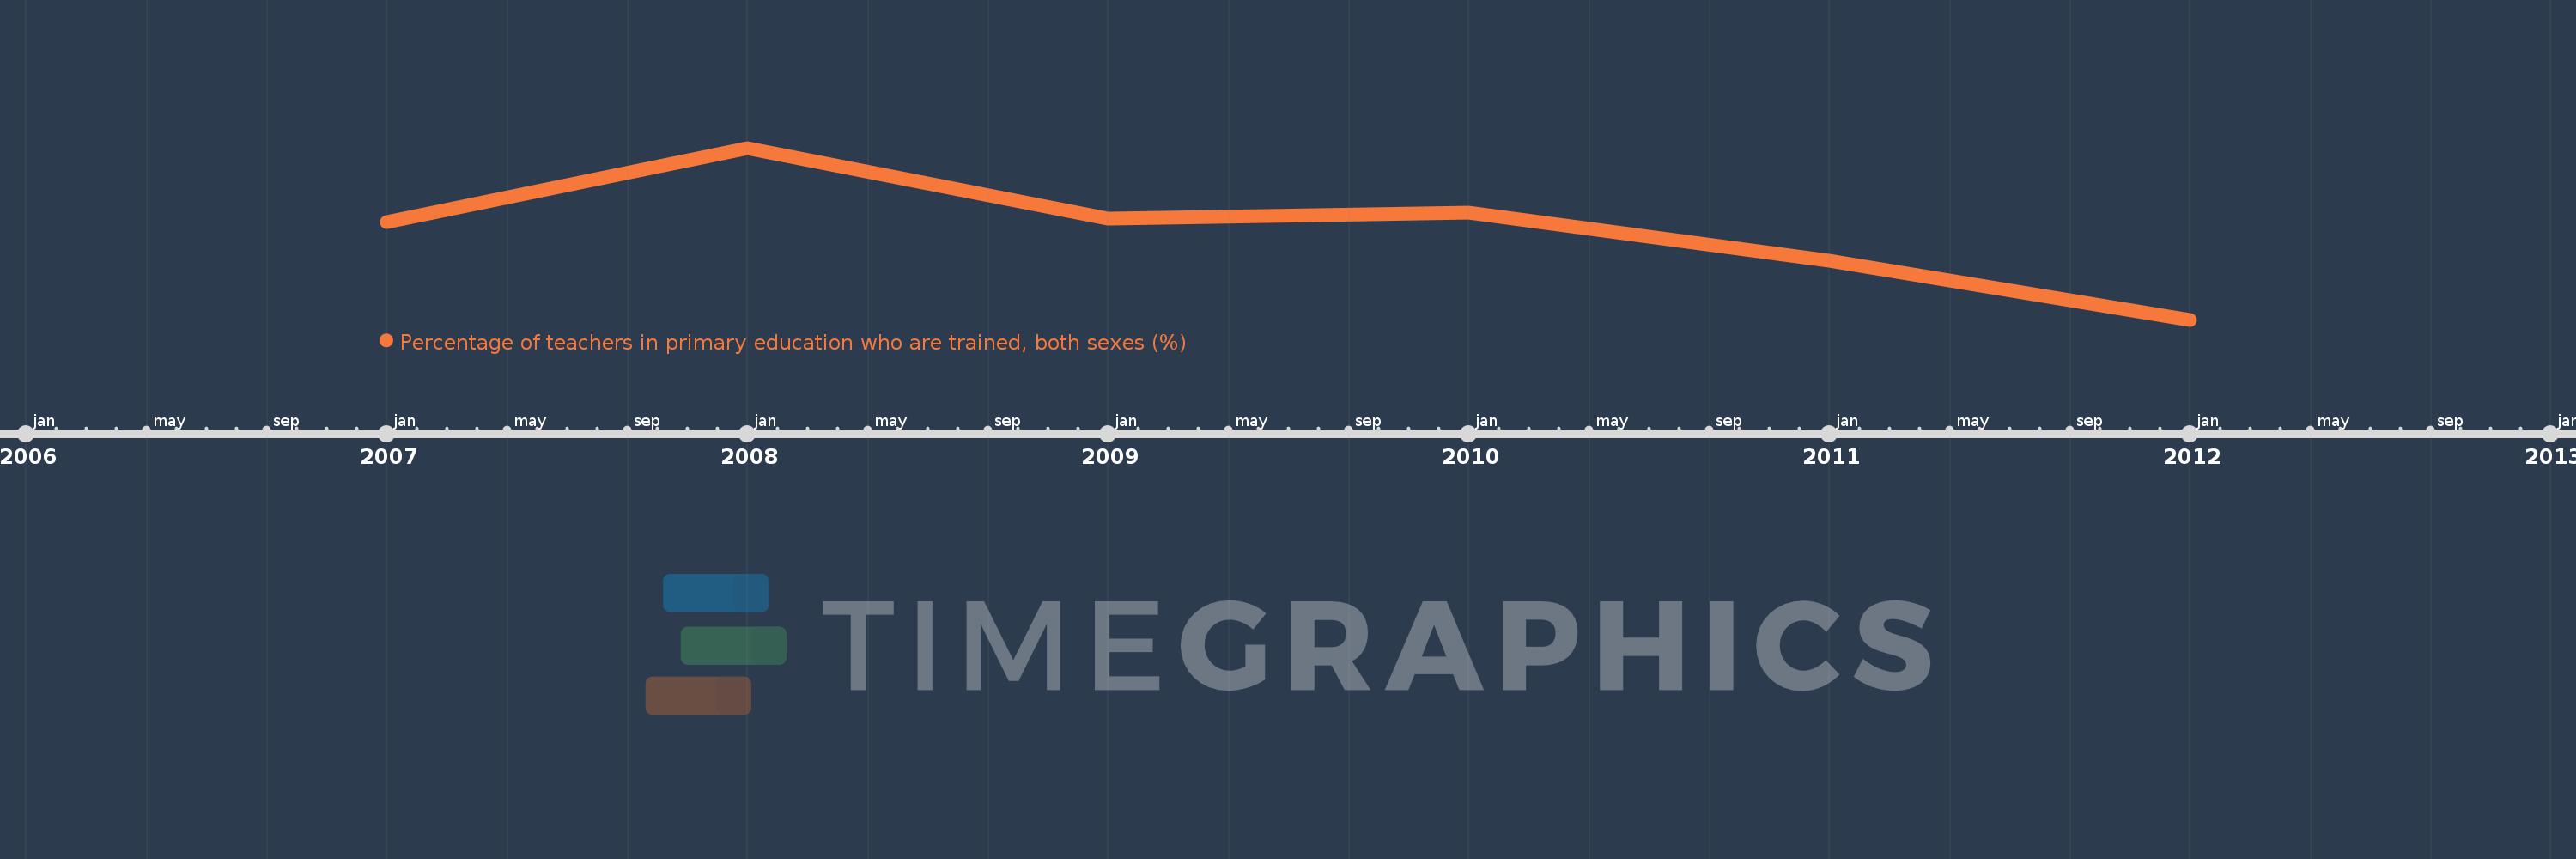
This timeline shows a graph from 2007 to 2012 of Latin America & the Caribbean (IDA & IBRD countries). No data until 2006. Number of actual observations by date: 6.
Source name:
World Development Indicators
Source organization:
United Nations Educational, Scientific, and Cultural Organization (UNESCO) Institute for Statistics.
Categories, topics:
Education
Last updated:
apr 23, 2017
Indicators value changes by year
Meaning:
87.709
Minimum:
86.282
jan 1, 2012
Maximum:
89.019
jan 1, 2008
At the date of observation
Value
Absolute change
Change from the previous value
jan 1, 2007
87.842
+87.842
0.0%
jan 1, 2008
89.019
+1.177
1.34%
jan 1, 2009
87.896
-1.124
-1.26%
jan 1, 2010
87.992
+0.096
0.11%
jan 1, 2011
87.222
-0.77
-0.88%
jan 1, 2012
86.282
-0.94
-1.08%
Ranking of countries by current statistics by years