Download This statistics in other country:
Timeline:
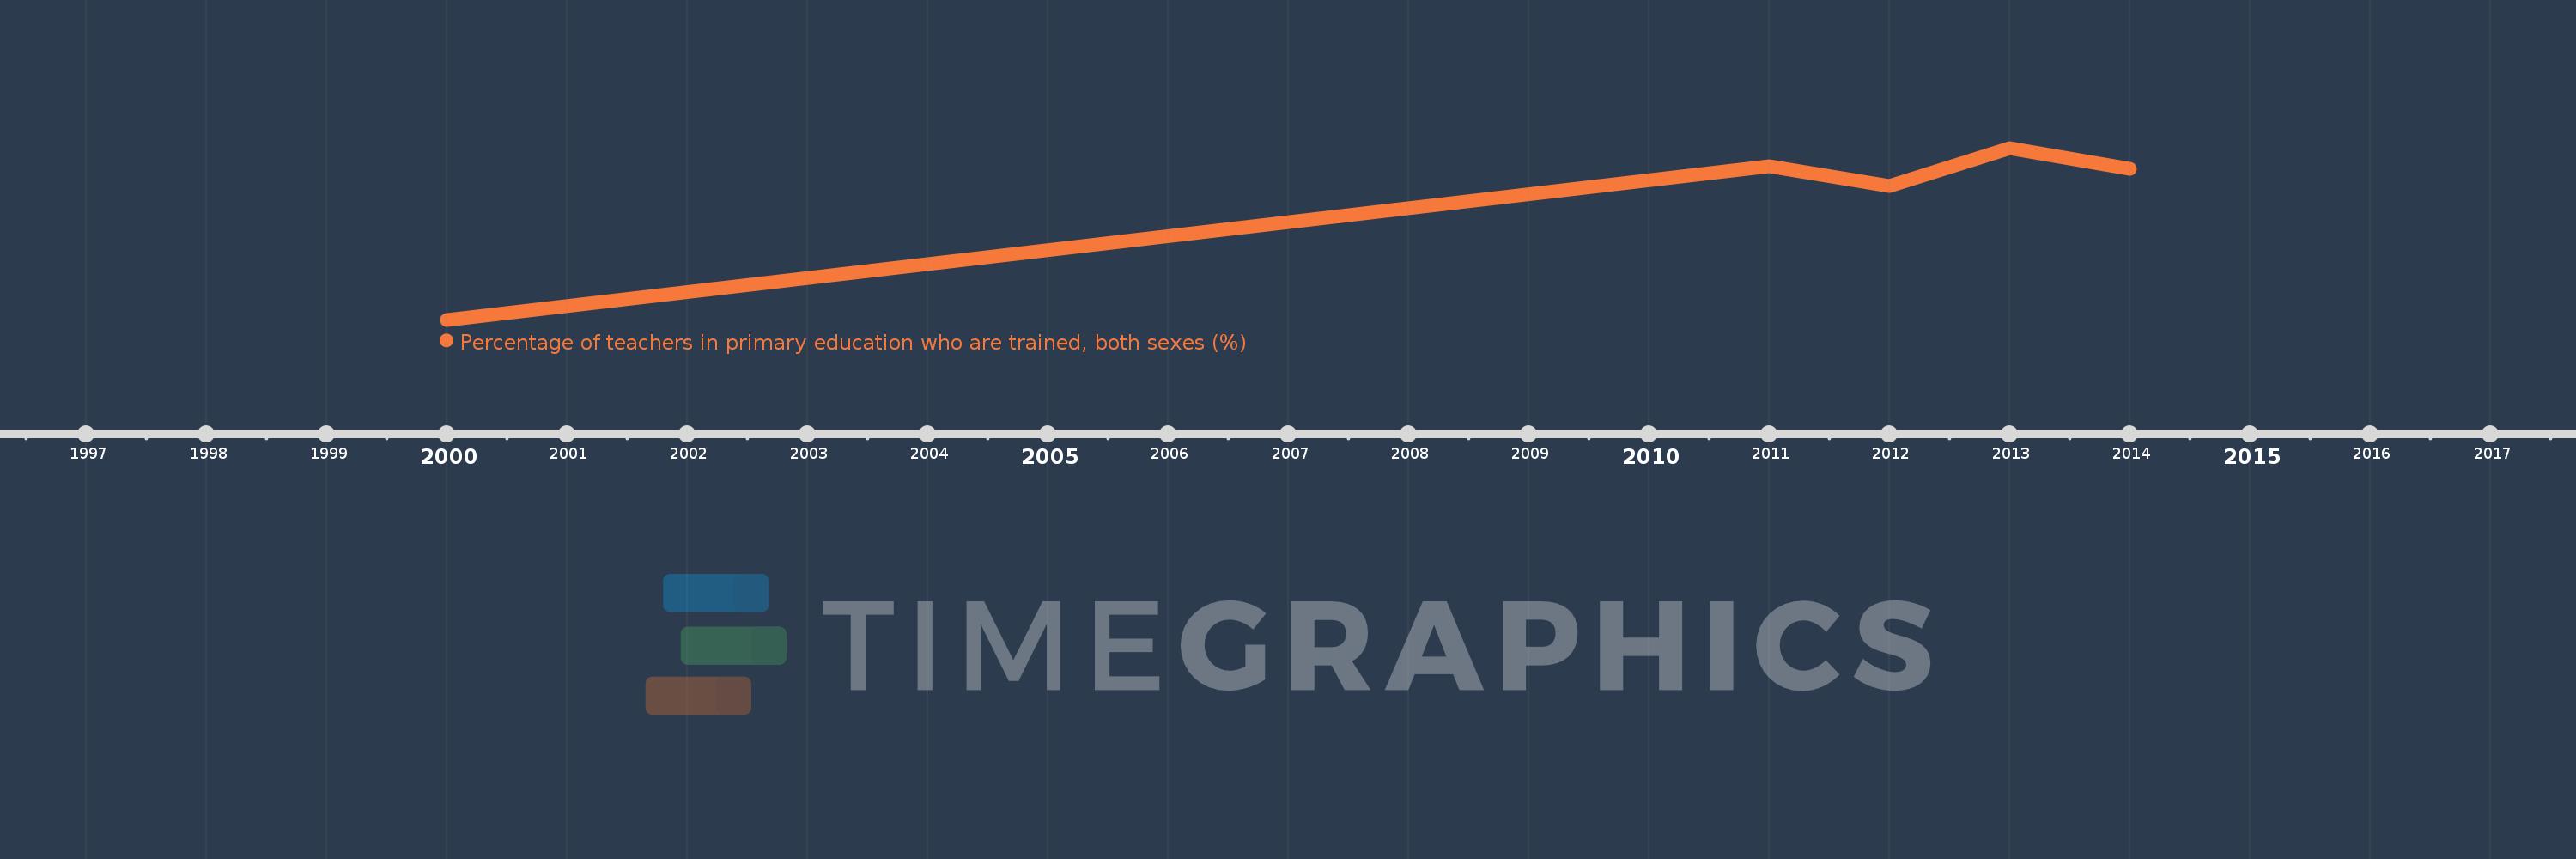
This timeline shows a graph from 2000 to 2014 of Togo. No data until 1999. Number of actual observations by date: 5.
Source name:
World Development Indicators
Source organization:
United Nations Educational, Scientific, and Cultural Organization (UNESCO) Institute for Statistics.
Categories, topics:
Education
Last updated:
apr 23, 2017
Indicators value changes by year
Minimum:
31.125
jan 1, 2000
Maximum:
82.139
jan 1, 2013
At the date of observation
Value
Absolute change
Change from the previous value
jan 1, 2000
31.125
+31.125
0.0%
jan 1, 2011
76.703
+45.578
146.44%
jan 1, 2012
70.797
-5.906
-7.7%
jan 1, 2013
82.139
+11.342
16.02%
jan 1, 2014
76.067
-6.072
-7.39%
Ranking of countries by current statistics by years