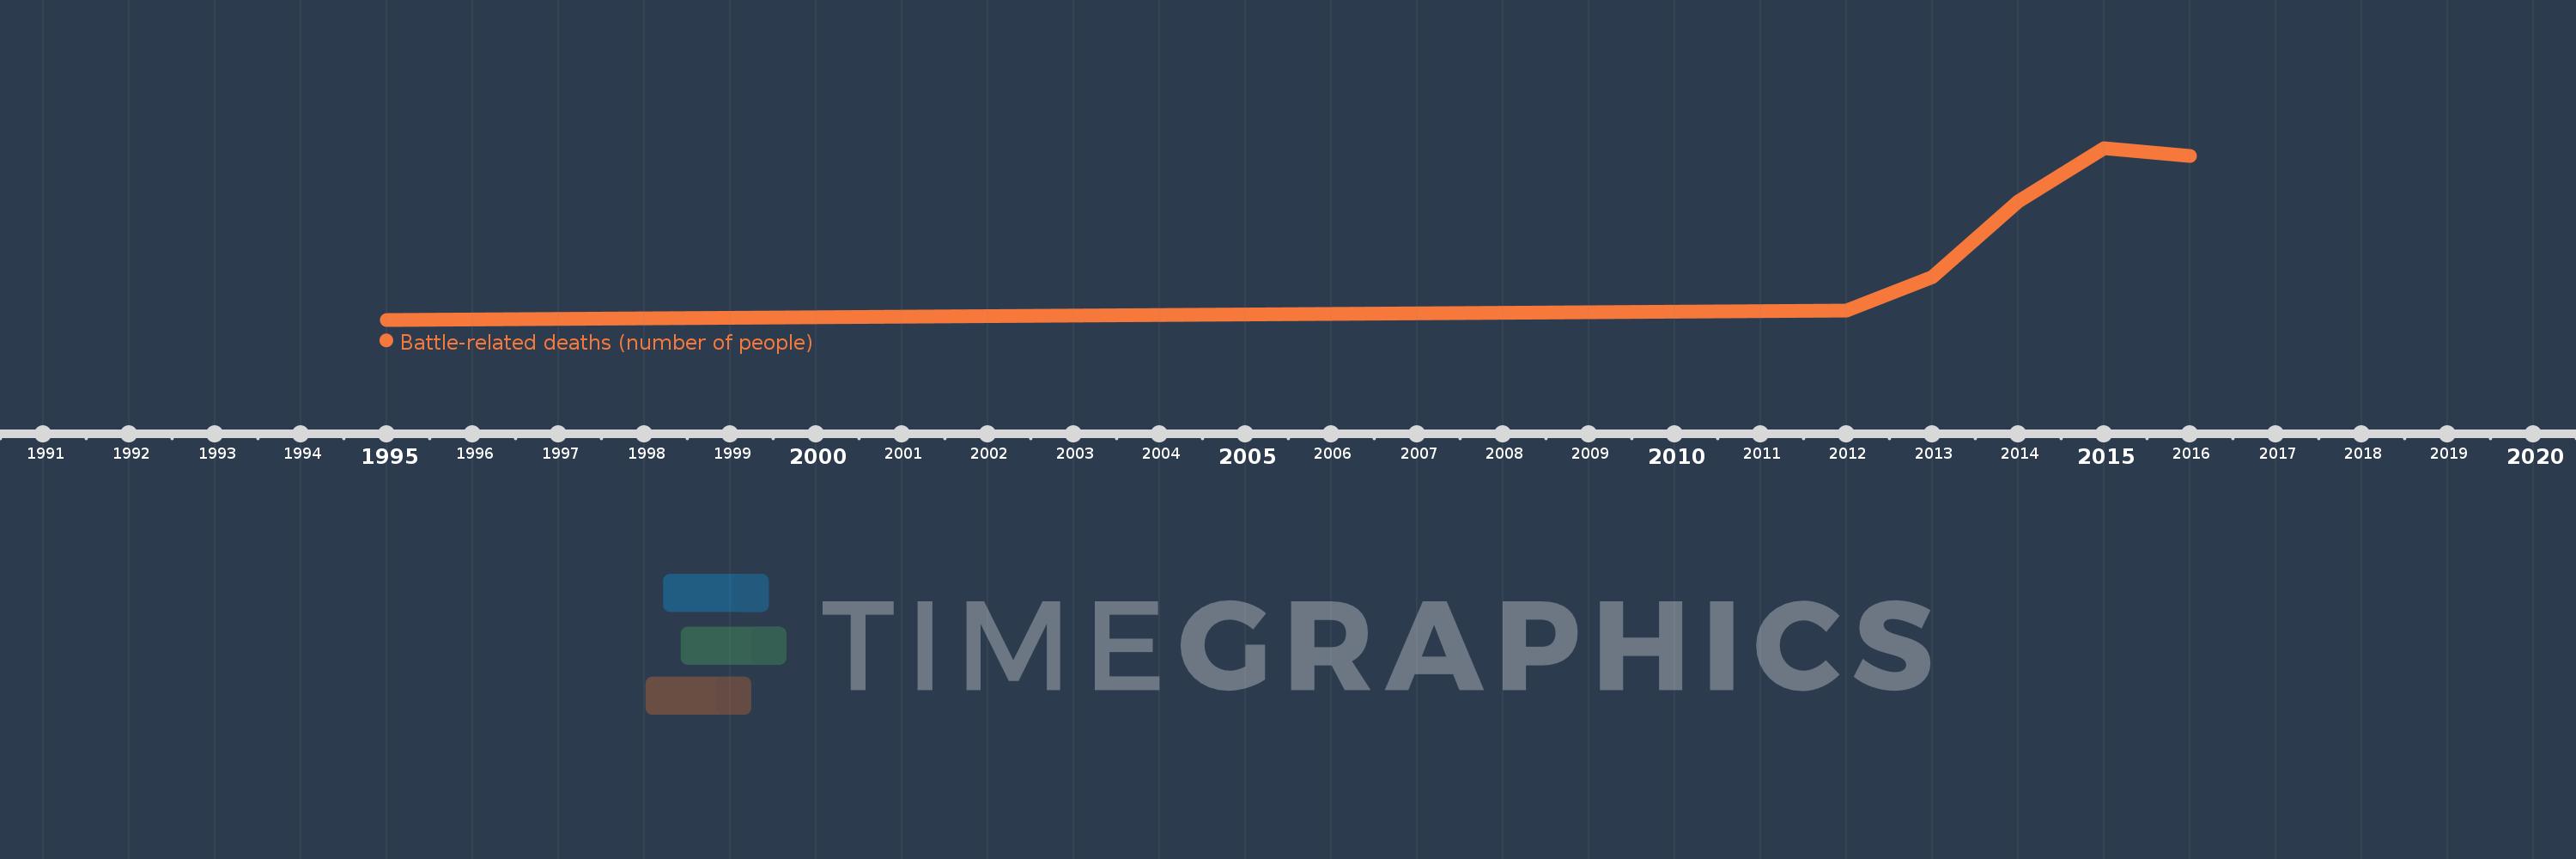
This timeline shows a graph from 1995 to 2016 of Fragile and conflict affected situations. No data until 1994. Number of actual observations by date: 6.
Source name:
World Development Indicators
Source organization:
Uppsala Conflict Data Program, http://www.pcr.uu.se/research/UCDP/.
Categories, topics:
Public Sector
Last updated:
apr 23, 2017
Indicators value changes by year
Meaning:
50.184K
Minimum:
12.923K
jan 1, 1995
Maximum:
88.858K
jan 1, 2015
At the date of observation
Value
Absolute change
Change from the previous value
jan 1, 1995
12.923K
+12.923K
0.0%
jan 1, 2012
17.098K
+4.175K
32.31%
jan 1, 2013
31.796K
+14.698K
85.96%
jan 1, 2014
65.177K
+33.381K
104.98%
jan 1, 2015
88.858K
+23.681K
36.33%
jan 1, 2016
85.25K
-3.608K
-4.06%
Ranking of countries by current statistics by years