Download This statistics in other country:
Timeline:
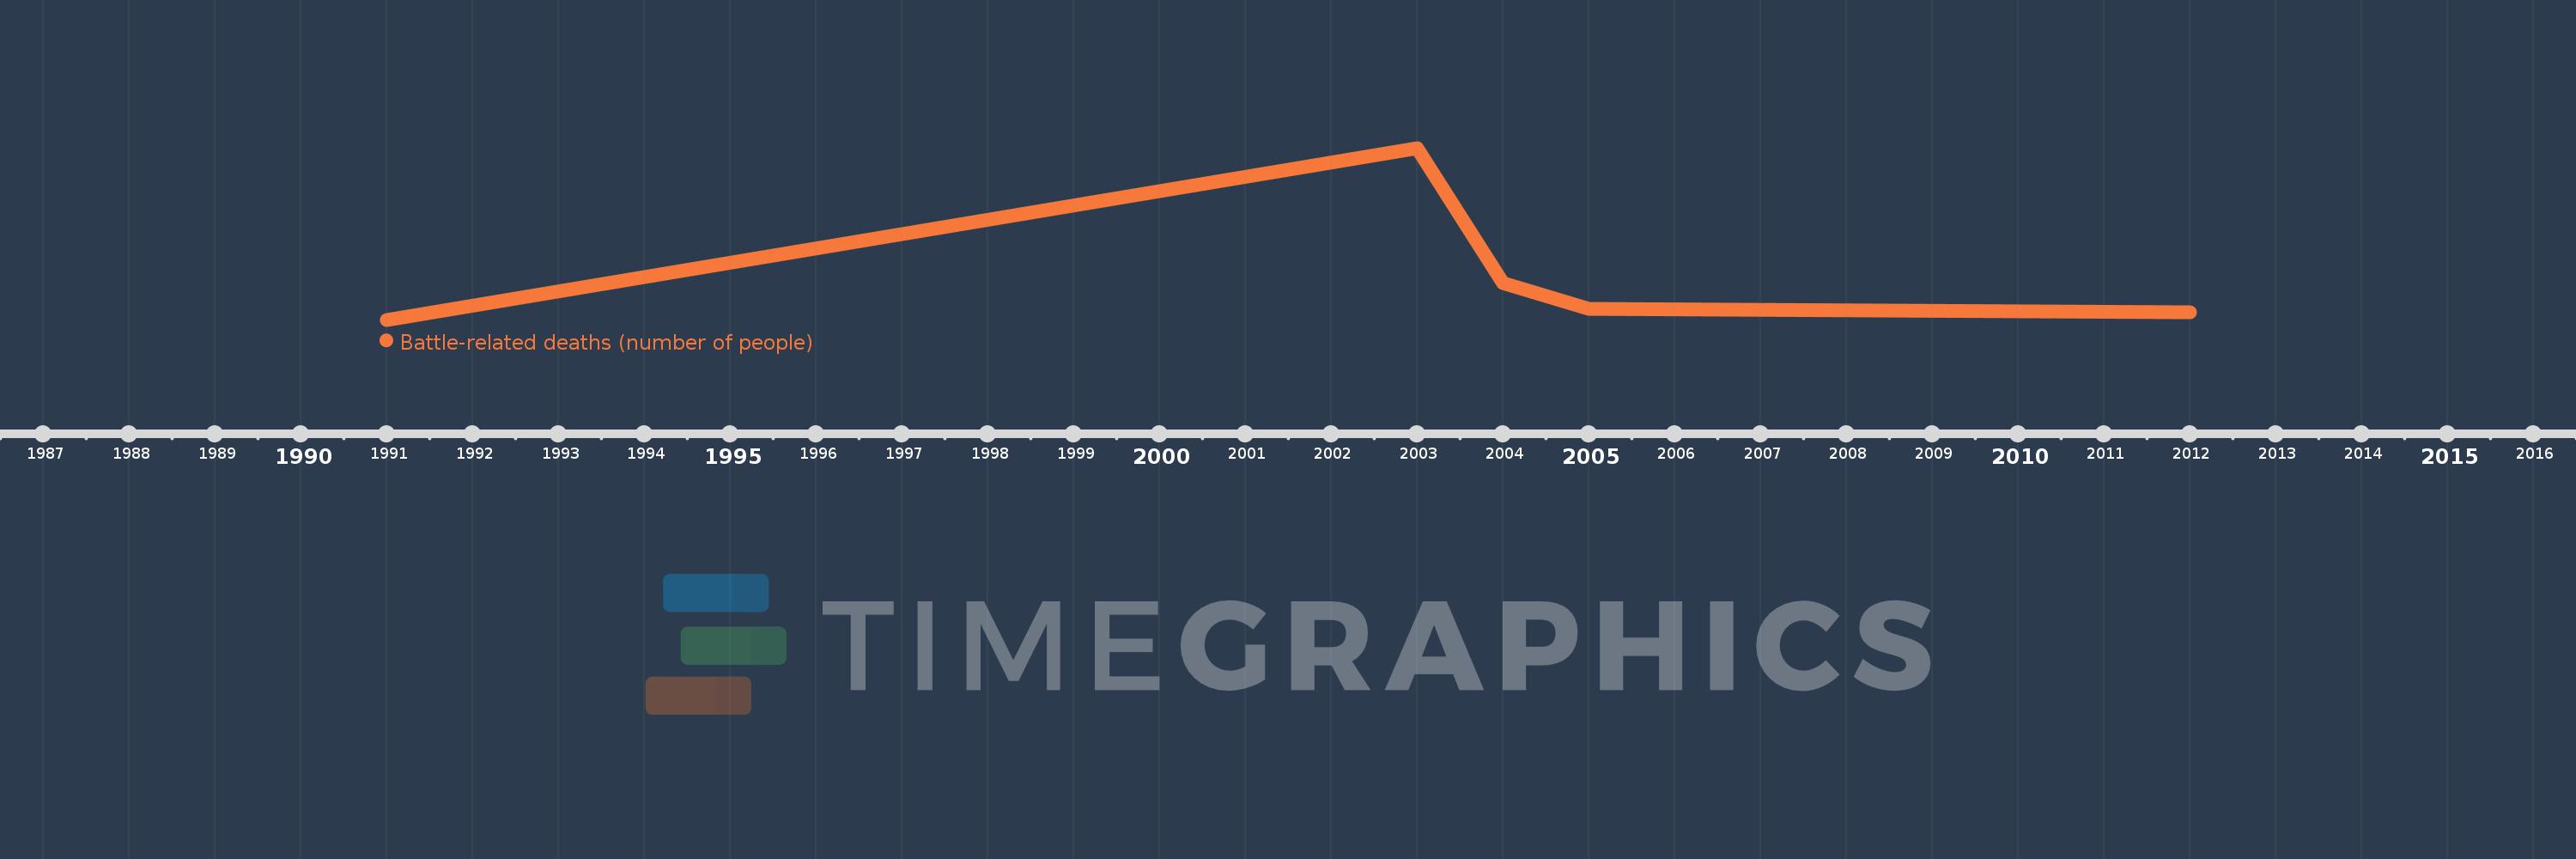
This timeline shows a graph from 1991 to 2012 of Cote d'Ivoire. No data until 1990. Number of actual observations by date: 5.
Source name:
World Development Indicators
Source organization:
Uppsala Conflict Data Program, http://www.pcr.uu.se/research/UCDP/.
Categories, topics:
Public Sector
Last updated:
apr 23, 2017
Indicators value changes by year
At the date of observation
Value
Absolute change
Change from the previous value
jan 1, 2003
624.0
+616.0
7.7K%
jan 1, 2004
139.0
-485.0
-77.72%
jan 1, 2005
47.0
-92.0
-66.19%
jan 1, 2012
35.0
-12.0
-25.53%
Ranking of countries by current statistics by years