Download This statistics in other country:
Timeline:
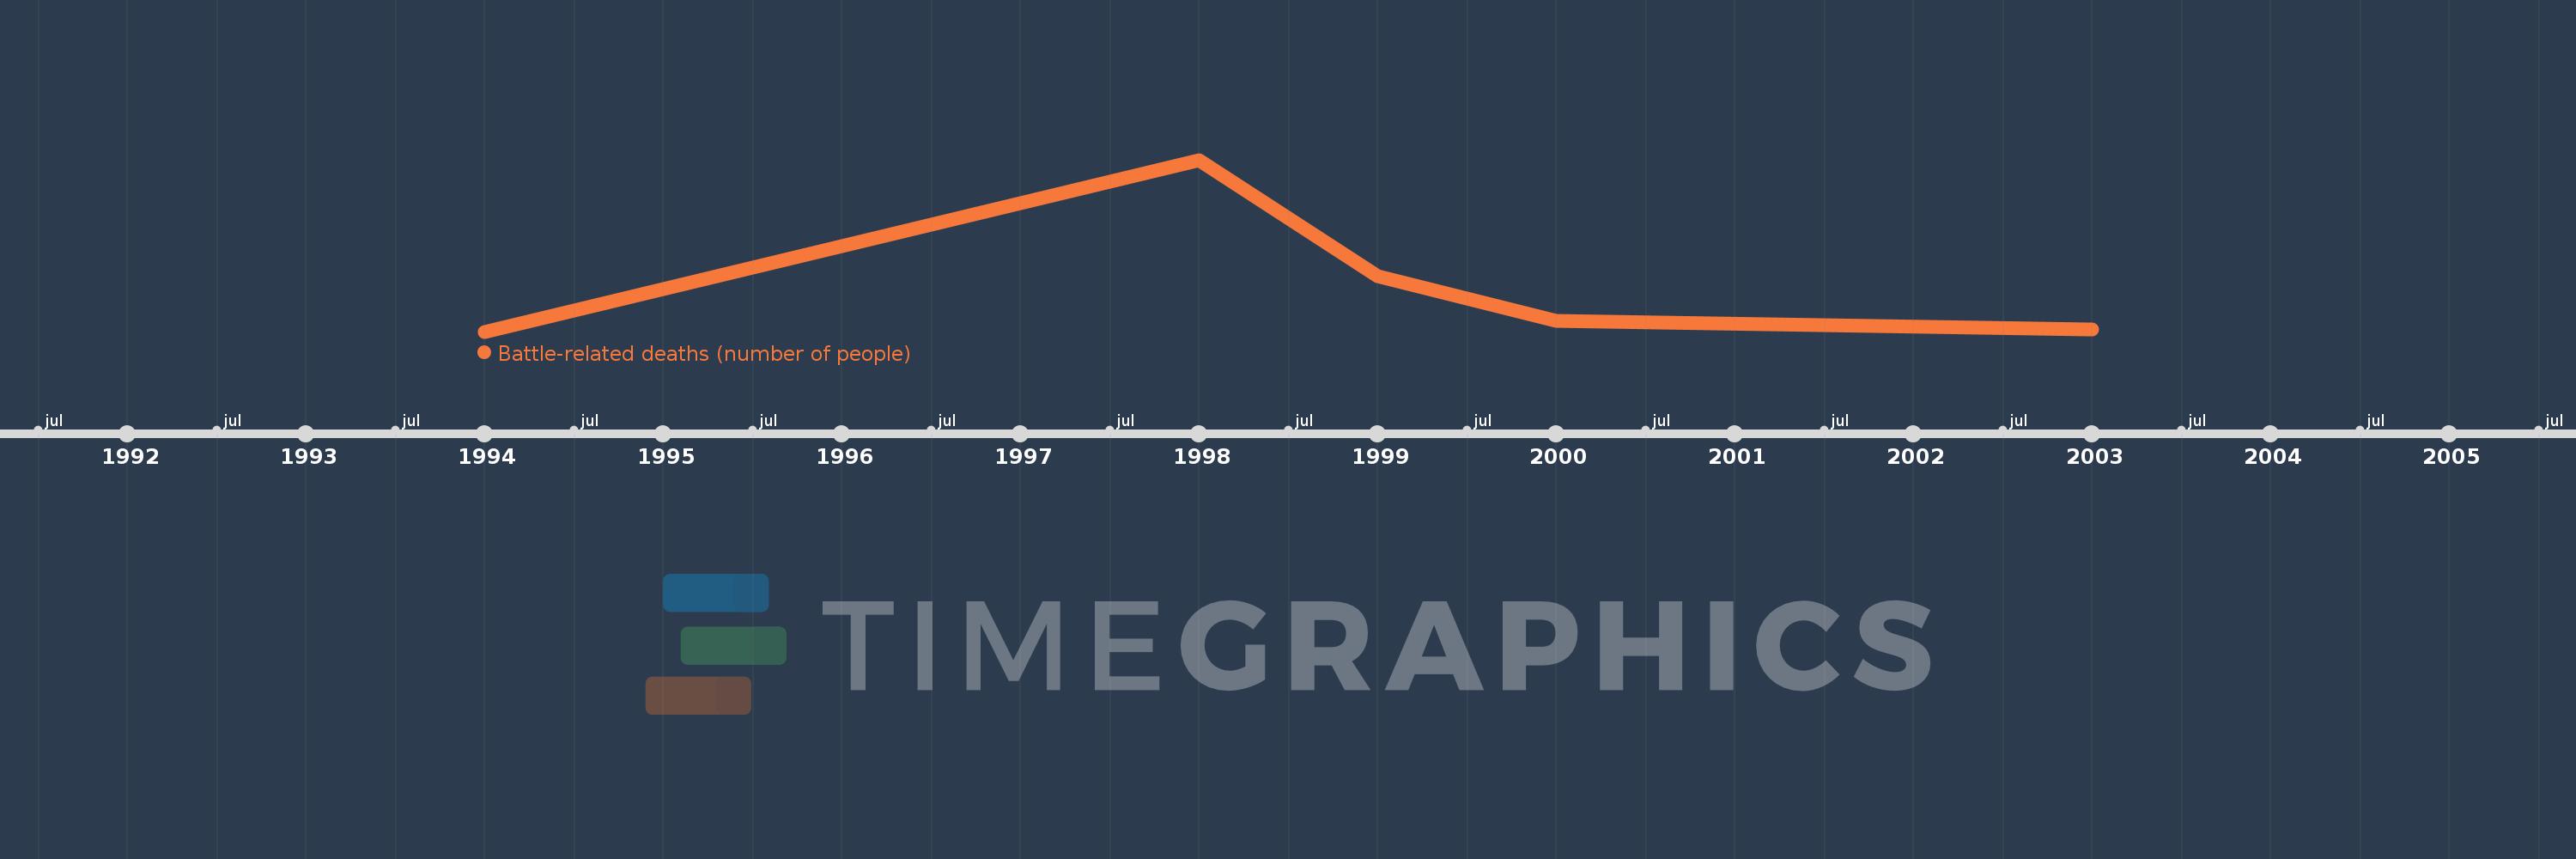
This timeline shows a graph from 1994 to 2003 of Congo, Rep.. No data until 1993. Number of actual observations by date: 5.
Source name:
World Development Indicators
Source organization:
Uppsala Conflict Data Program, http://www.pcr.uu.se/research/UCDP/.
Categories, topics:
Public Sector
Last updated:
apr 23, 2017
Indicators value changes by year
At the date of observation
Value
Absolute change
Change from the previous value
jan 1, 1994
53.0
+53.0
0.0%
jan 1, 1998
10.0K
+9.947K
18.77K%
jan 1, 1999
3.272K
-6.728K
-67.28%
jan 1, 2000
651.0
-2.621K
-80.1%
jan 1, 2003
167.0
-484.0
-74.35%
Ranking of countries by current statistics by years