Download This statistics in other country:
Timeline:
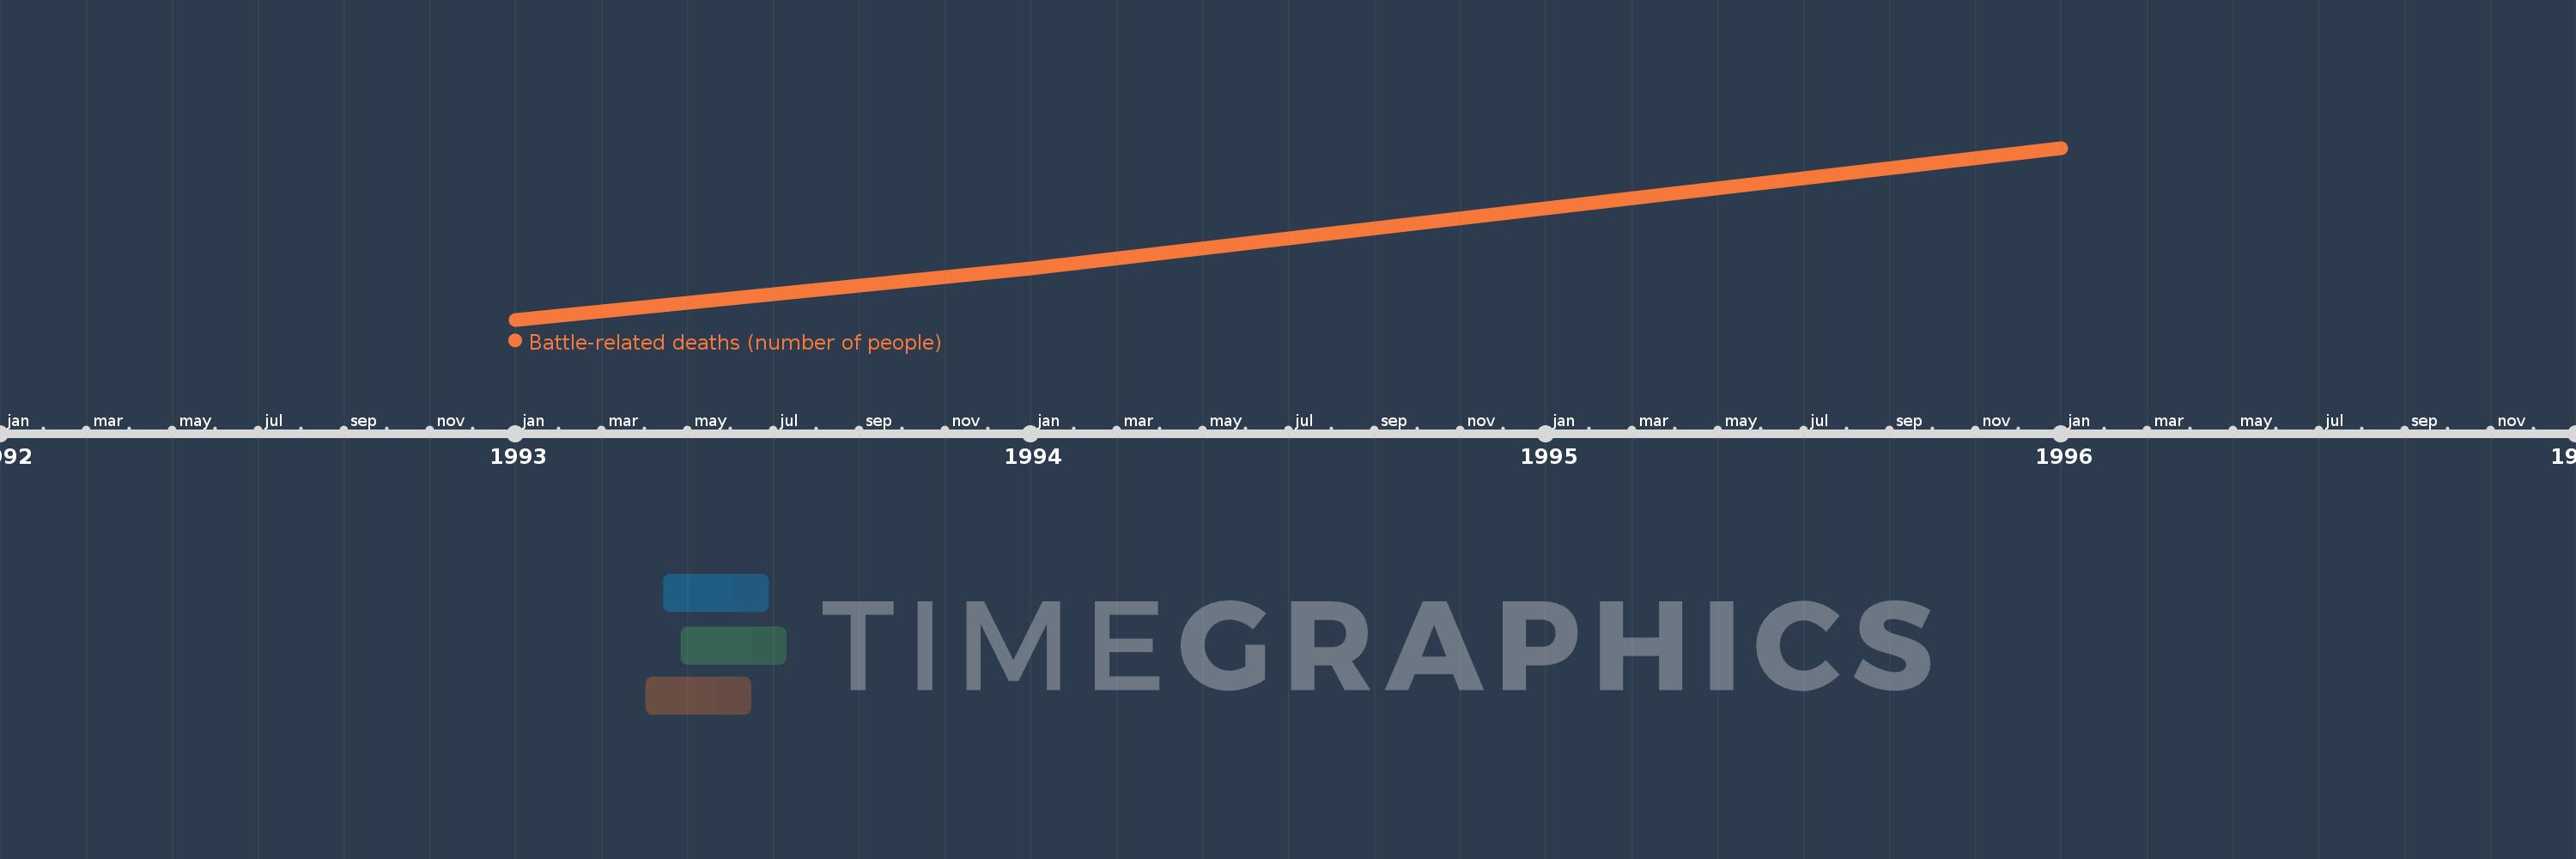
This timeline shows a graph from 1993 to 1996 of Croatia. No data until 1992. Number of actual observations by date: 3.
Source name:
World Development Indicators
Source organization:
Uppsala Conflict Data Program, http://www.pcr.uu.se/research/UCDP/.
Categories, topics:
Public Sector
Last updated:
apr 23, 2017
Indicators value changes by year
At the date of observation
Value
Absolute change
Change from the previous value
jan 1, 1993
142.0
+142.0
0.0%
jan 1, 1994
345.0
+203.0
142.96%
jan 1, 1996
826.0
+481.0
139.42%
Ranking of countries by current statistics by years