33
/
AIzaSyB4mHJ5NPEv-XzF7P6NDYXjlkCWaeKw5bc
November 30, 2025
109358
Congo, Dem. Rep.
COD
true
2
1
Battle-related deaths (number of people)
2016,2015,2014,2013,2012,2011,2010,2009,2008,2007,2003,2002,2001,2000,1999,1998,1997,1995
Create a timeline
Public Timelines
For education
For educational institutions
For teachers
For students
Cabinet
For educational institutions
For teachers
For students
Open cabinet
FAQ
Close
Create a timeline
Public timelines
FAQ
About & Feedback
Terms
Privacy
FAQ
Support 24/7
Cabinet
Get premium
Donate
Download
Global statistics library
→
Congo, Dem. Rep.
→
Battle-related deaths (number of people)
This statistics in other country:
Afghanistan
Albania
Algeria
Angola
Arab World
Argentina
Armenia
Azerbaijan
Bangladesh
Bhutan
Bosnia and Herzegovina
Burundi
Cambodia
Cameroon
Central African Republic
Chad
China
Colombia
Comoros
Congo, Dem. Rep.
Congo, Rep.
Cote d'Ivoire
Croatia
Djibouti
Early-demographic dividend
East Asia & Pacific
East Asia & Pacific (excluding high income)
East Asia & Pacific (IDA & IBRD countries)
Ecuador
Egypt, Arab Rep.
El Salvador
Eritrea
Ethiopia
Europe & Central Asia (excluding high income)
Fragile and conflict affected situations
France
Georgia
Germany
Guatemala
Guinea
Guinea-Bissau
Haiti
IBRD only
IDA & IBRD total
IDA blend
India
Indonesia
Iran, Islamic Rep.
Iraq
Ireland
Israel
Italy
Jordan
Kenya
Kuwait
Kyrgyz Republic
Lao PDR
Late-demographic dividend
Lebanon
Lesotho
Liberia
Libya
Low & middle income
Lower middle income
Macedonia, FYR
Malaysia
Mali
Malta
Mauritania
Mexico
Middle East & North Africa (excluding high income)
Middle East & North Africa (IDA & IBRD countries)
Middle income
Moldova
Morocco
Mozambique
Myanmar
Namibia
Nepal
Netherlands
Nicaragua
Niger
Nigeria
North America
Pakistan
Panama
Papua New Guinea
Paraguay
Peru
Philippines
Qatar
Romania
Russian Federation
Rwanda
Saudi Arabia
Senegal
Serbia
Sierra Leone
Solomon Islands
Somalia
South Africa
South Asia
South Asia (IDA & IBRD)
South Sudan
Spain
Sri Lanka
Sudan
Syrian Arab Republic
Tajikistan
Thailand
Trinidad and Tobago
Turkey
Uganda
Ukraine
United Kingdom
United States
Upper middle income
Uzbekistan
Venezuela, RB
Yemen, Rep.
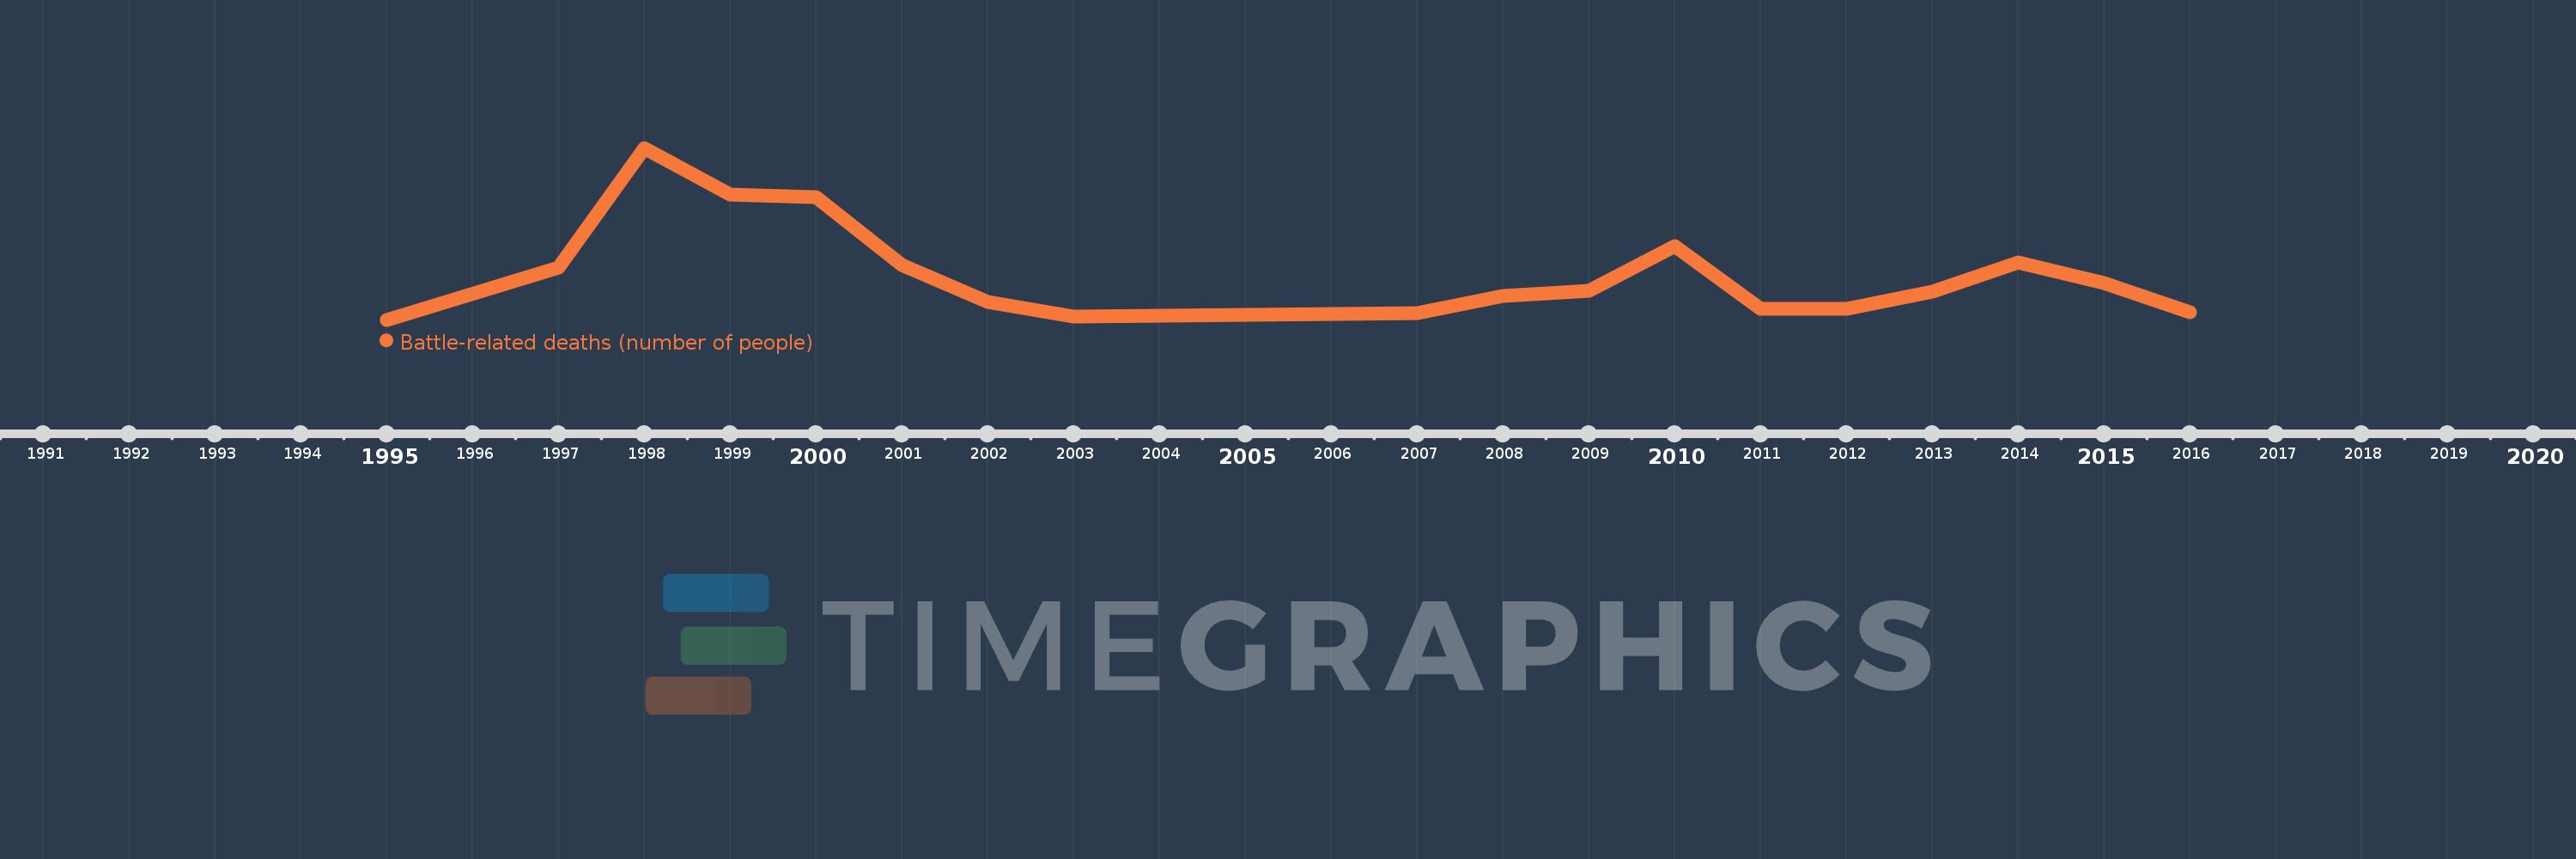
Timeline:
This timeline shows a graph from
1995
to
2016
of Congo, Dem. Rep.. No data until
1994
. Number of actual observations by date:
18
.
Source name:
World Development Indicators
Source organization:
Uppsala Conflict Data Program, http://www.pcr.uu.se/research/UCDP/.
Categories, topics:
Public Sector
Last updated:
apr 23, 2017
Indicators value changes by year
Meaning:
1.237K
Minimum:
0.0
jan 1, 1995
Maximum:
4.591K
jan 1, 1998
At the date of observation
Value
Absolute change
Change from the previous value
jan 1, 1995
0.0
0.0
0.0%
jan 1, 1997
1.389K
+1.389K
%
jan 1, 1998
4.591K
+3.202K
230.53%
jan 1, 1999
3.356K
-1.235K
-26.9%
jan 1, 2000
3.282K
-74.0
-2.21%
jan 1, 2001
1.473K
-1.809K
-55.12%
jan 1, 2002
486.0
-987.0
-67.01%
jan 1, 2003
76.0
-410.0
-84.36%
jan 1, 2007
177.0
+101.0
132.89%
jan 1, 2008
632.0
+455.0
257.06%
jan 1, 2009
767.0
+135.0
21.36%
jan 1, 2010
1.978K
+1.211K
157.89%
jan 1, 2011
300.0
-1.678K
-84.83%
jan 1, 2012
283.0
-17.0
-5.67%
jan 1, 2013
755.0
+472.0
166.78%
jan 1, 2014
1.531K
+776.0
102.78%
jan 1, 2015
985.0
-546.0
-35.66%
jan 1, 2016
197.0
-788.0
-80.0%
Ranking of countries by current statistics by years
About & Feedback
Terms
Privacy
FAQ
Support 24/7
Cabinet
Get premium
Donate
The service accepts bank transfer (ACH, Wire) or cards (Visa, MasterCard, etc). Processed by Stripe.
Secured with SSL