Download This statistics in other country:
Timeline:
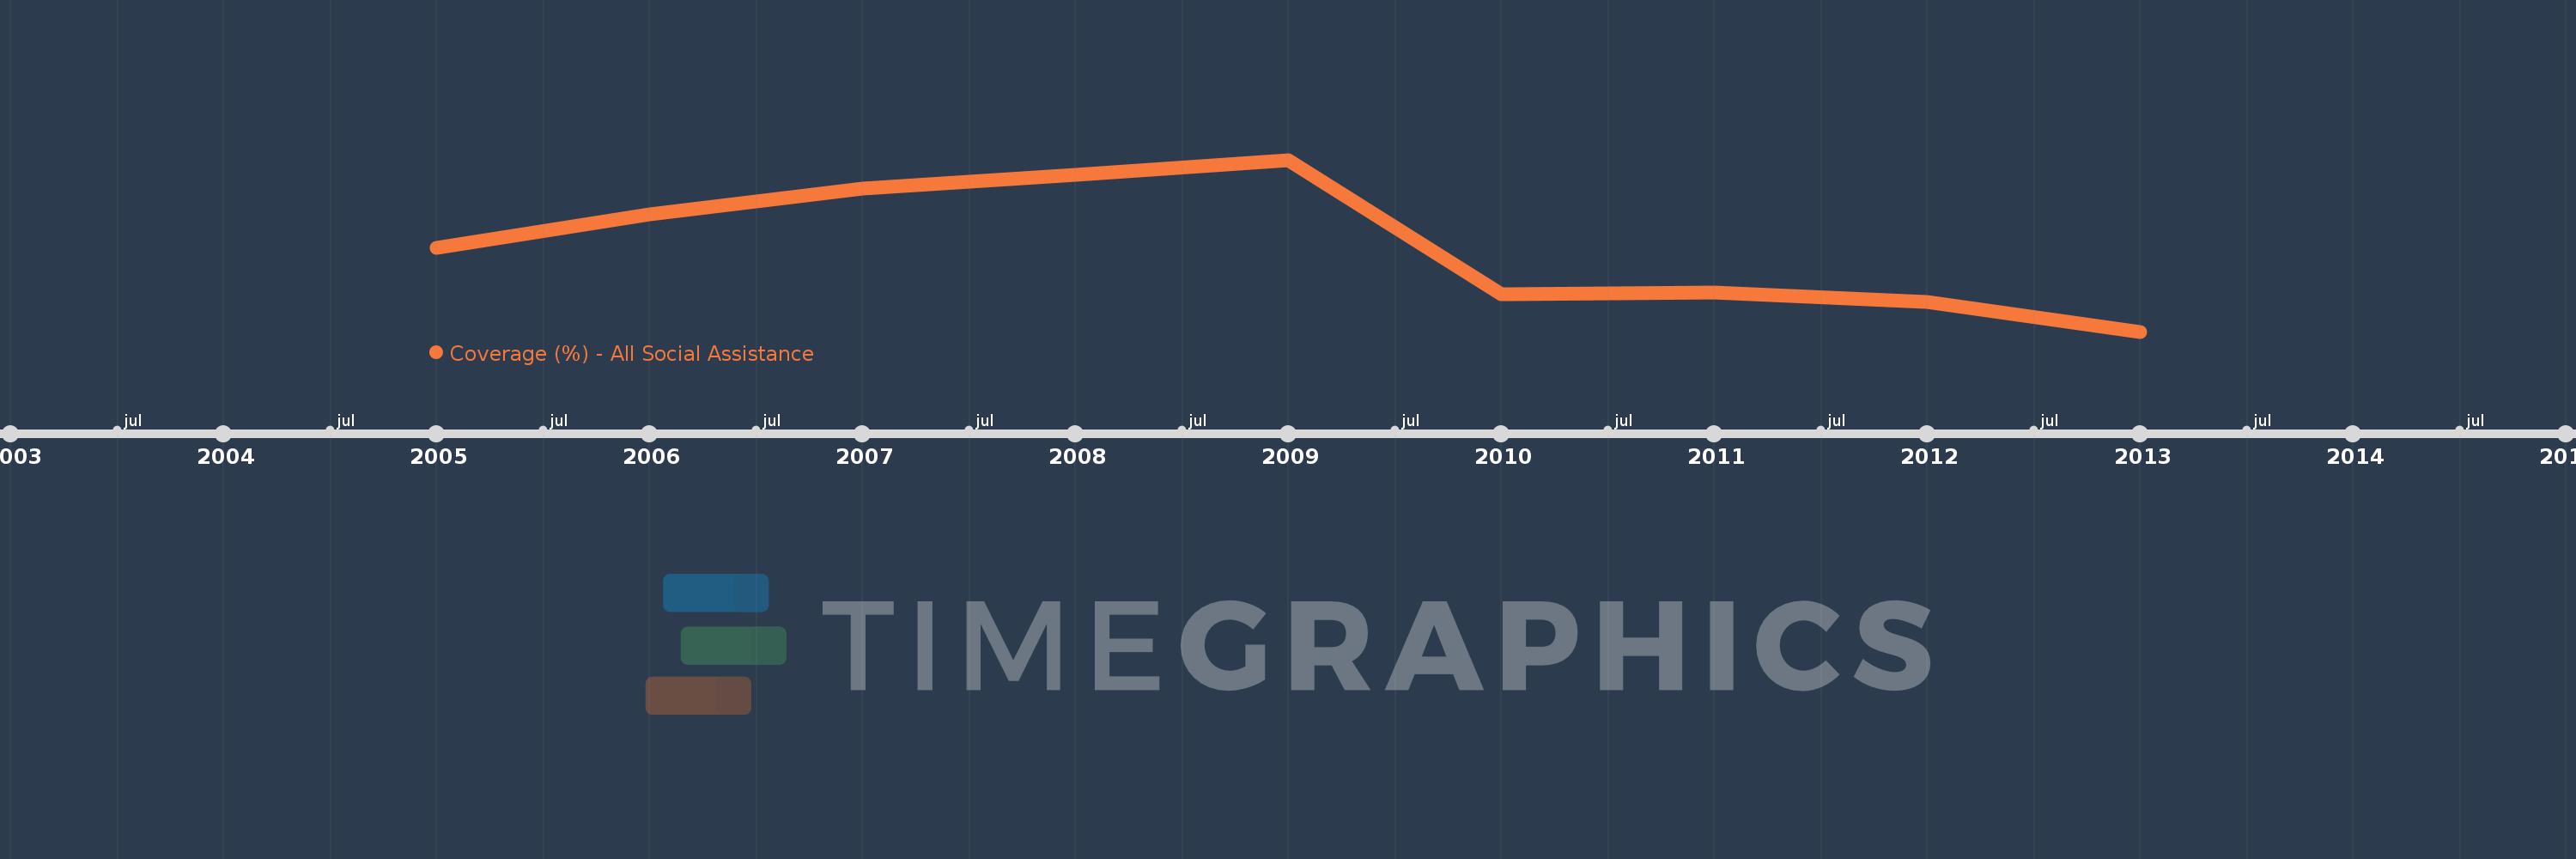
This timeline shows a graph from 2005 to 2013 of Turkey. No data until 2004. Number of actual observations by date: 9.
Source name:
World Development Indicators
Source organization:
The Atlas of Social Protection: Indicators of Resilience and Equity (ASPIRE)
Categories, topics:
Social Protection & Labor
Last updated:
apr 23, 2017
Indicators value changes by year
Minimum:
21.227
jan 1, 2013
Maximum:
43.523
jan 1, 2009
At the date of observation
Value
Absolute change
Change from the previous value
jan 1, 2005
32.107
+32.107
0.0%
jan 1, 2006
36.393
+4.286
13.35%
jan 1, 2007
39.765
+3.372
9.27%
jan 1, 2008
41.605
+1.841
4.63%
jan 1, 2009
43.523
+1.918
4.61%
jan 1, 2010
26.111
-17.412
-40.01%
jan 1, 2011
26.337
+0.226
0.87%
jan 1, 2012
25.122
-1.215
-4.61%
jan 1, 2013
21.227
-3.895
-15.51%
Ranking of countries by current statistics by years