Download This statistics in other country:
Timeline:
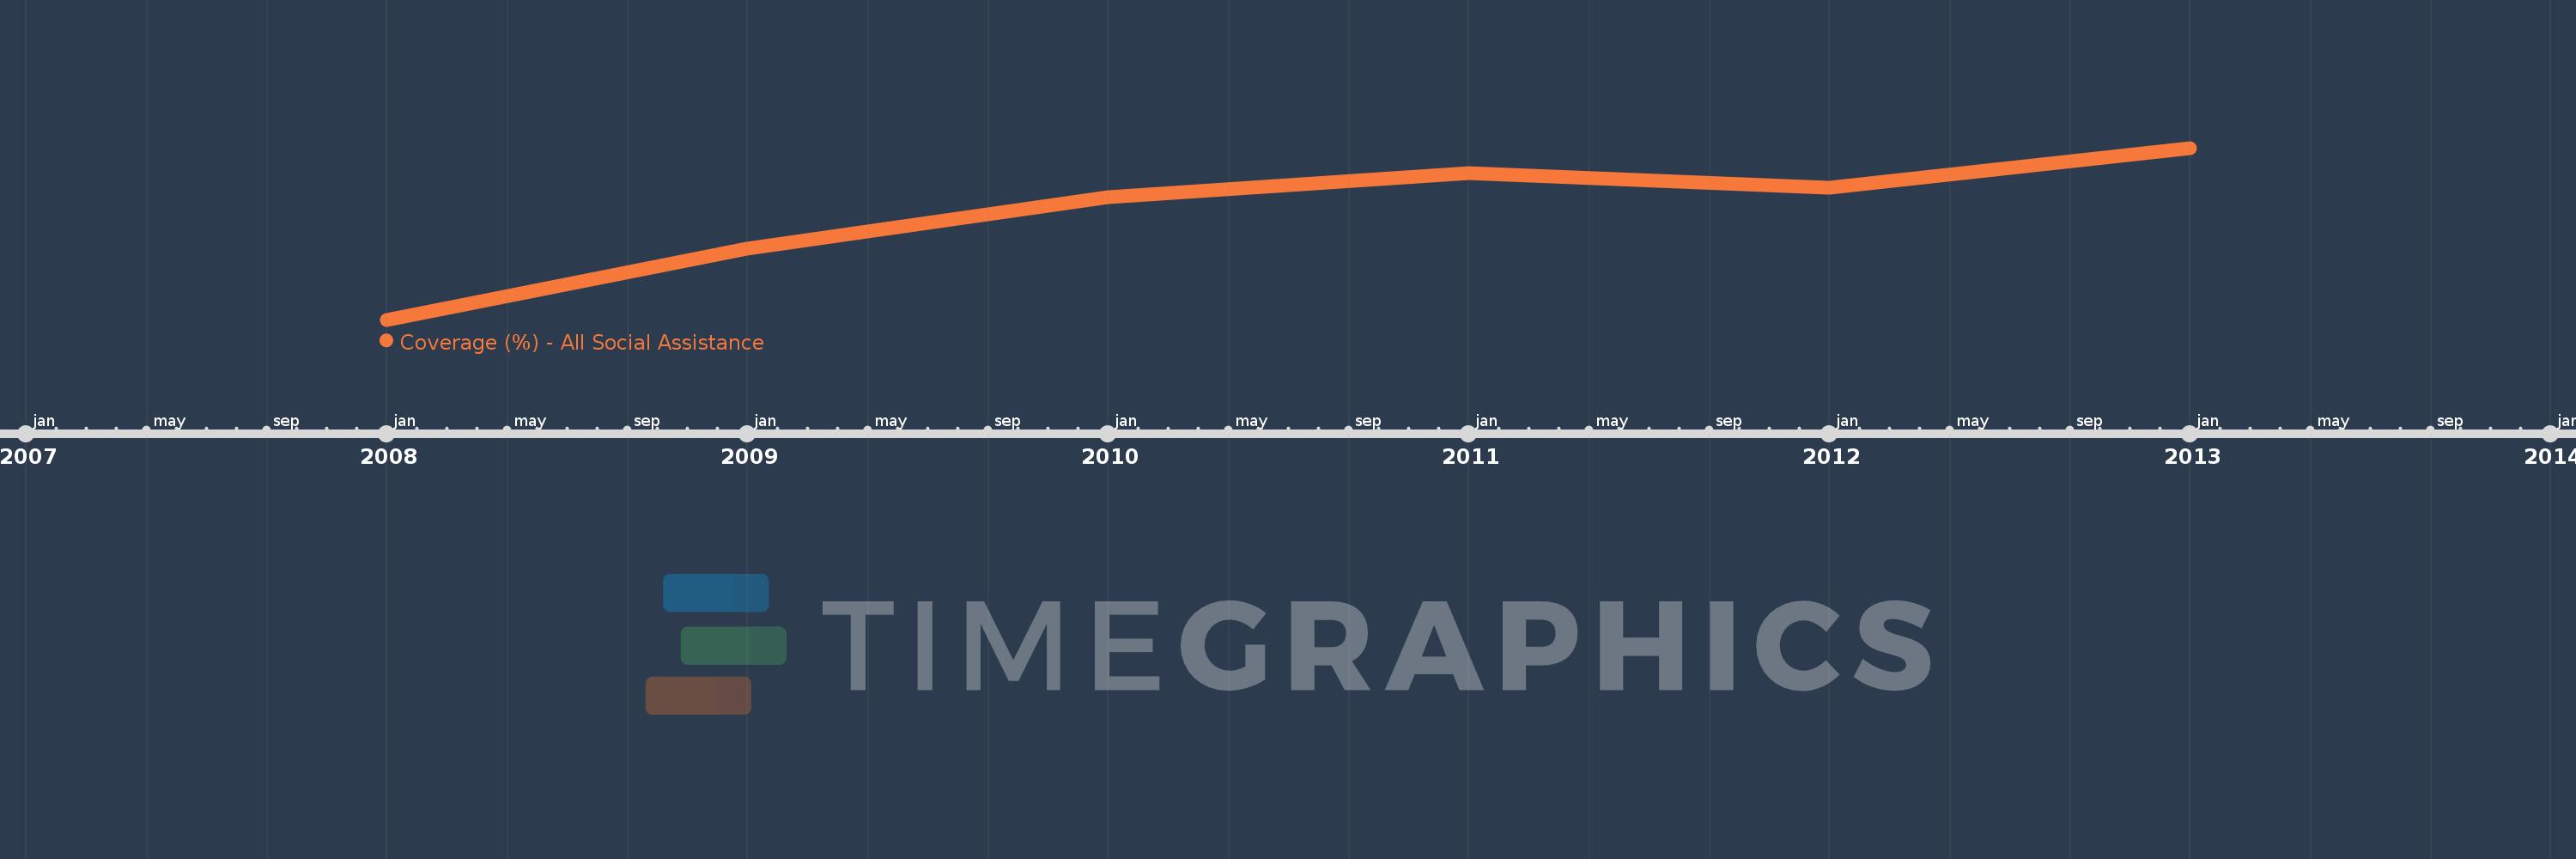
This timeline shows a graph from 2008 to 2013 of Dominican Republic. No data until 2007. Number of actual observations by date: 6.
Source name:
World Development Indicators
Source organization:
The Atlas of Social Protection: Indicators of Resilience and Equity (ASPIRE)
Categories, topics:
Social Protection & Labor
Last updated:
apr 23, 2017
Indicators value changes by year
Maximum:
31.498
jan 1, 2013
At the date of observation
Value
Absolute change
Change from the previous value
jan 1, 2008
10.41
+10.41
0.0%
jan 1, 2009
19.138
+8.727
83.83%
jan 1, 2010
25.491
+6.353
33.2%
jan 1, 2011
28.373
+2.882
11.31%
jan 1, 2012
26.581
-1.793
-6.32%
jan 1, 2013
31.498
+4.917
18.5%
Ranking of countries by current statistics by years