Download This statistics in other country:
Timeline:
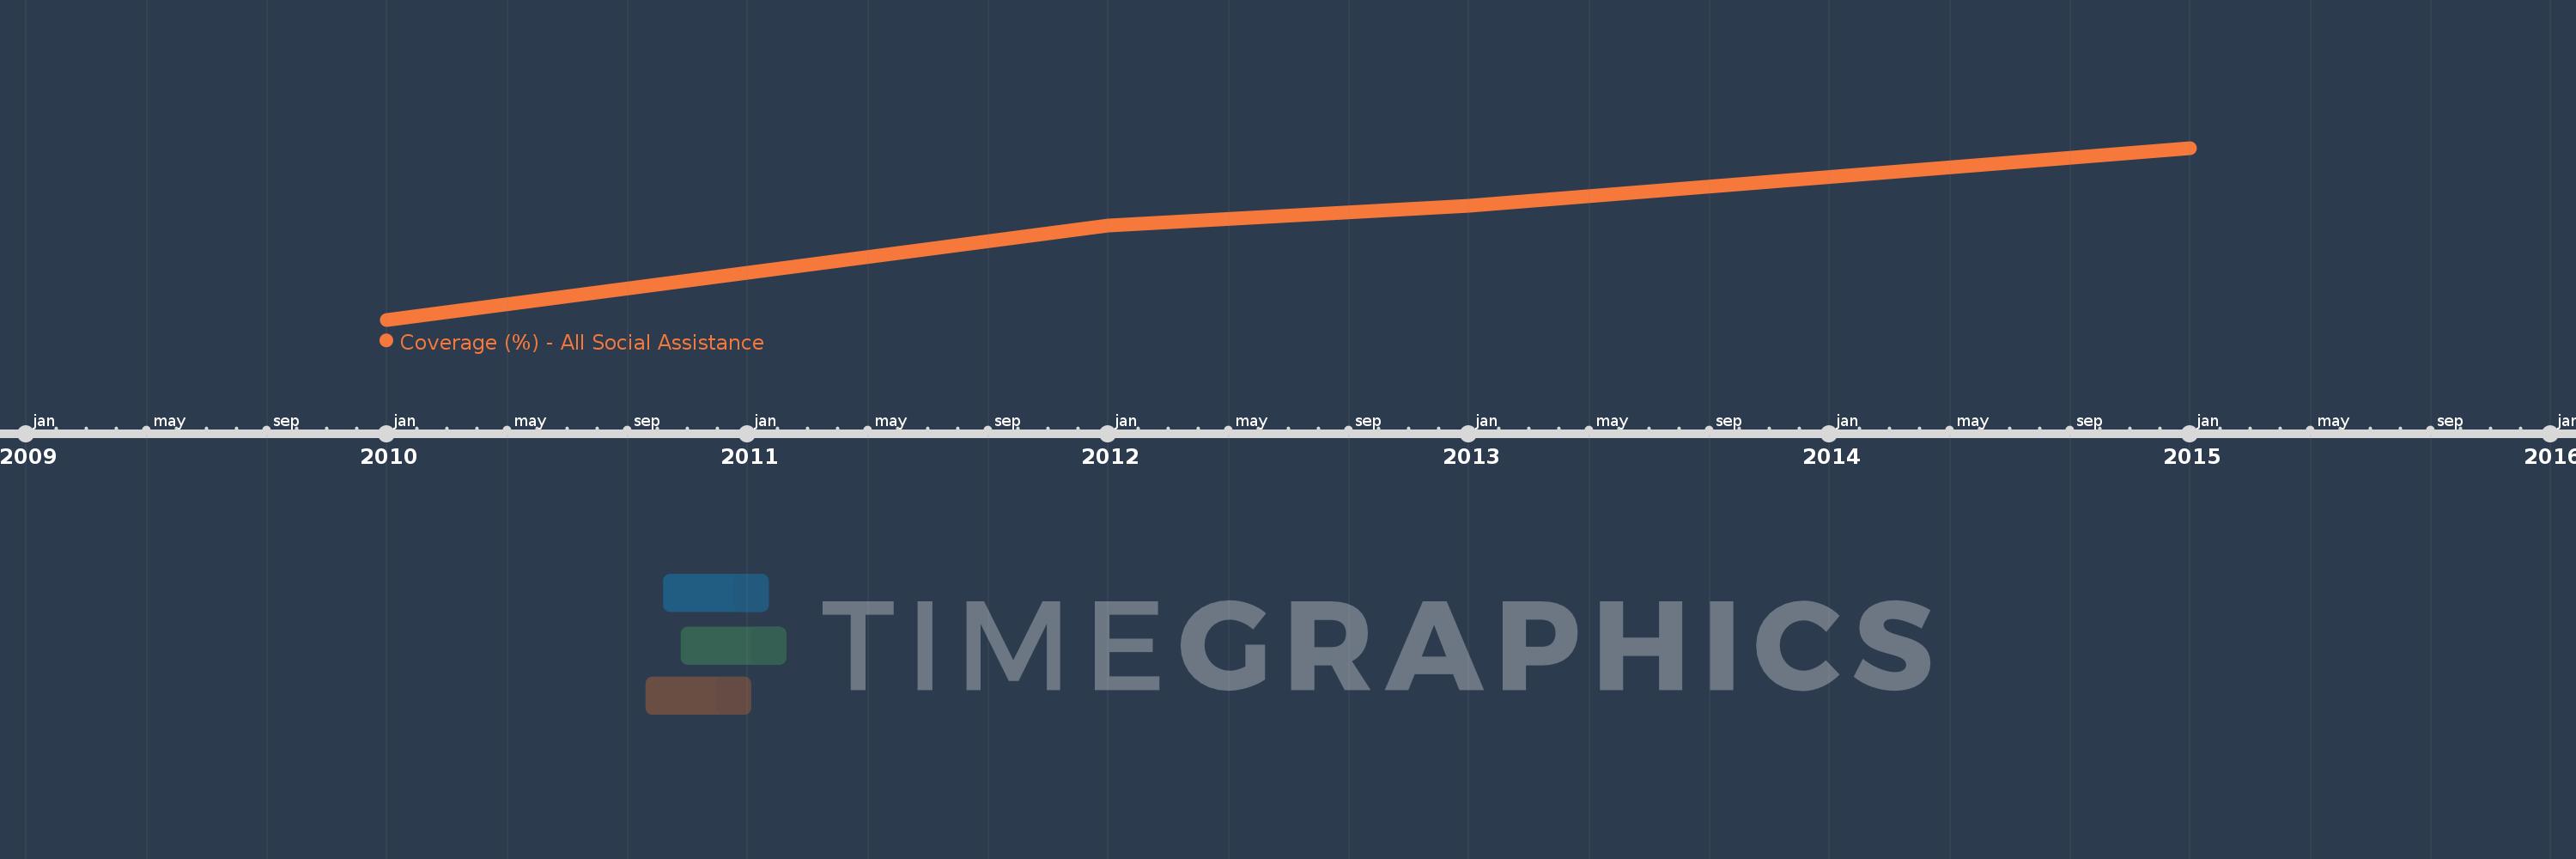
This timeline shows a graph from 2010 to 2015 of Indonesia. No data until 2009. Number of actual observations by date: 4.
Source name:
World Development Indicators
Source organization:
The Atlas of Social Protection: Indicators of Resilience and Equity (ASPIRE)
Categories, topics:
Social Protection & Labor
Last updated:
apr 23, 2017
Indicators value changes by year
Minimum:
43.425
jan 1, 2010
Maximum:
62.424
jan 1, 2015
At the date of observation
Value
Absolute change
Change from the previous value
jan 1, 2010
43.425
+43.425
0.0%
jan 1, 2012
53.868
+10.442
24.05%
jan 1, 2013
56.039
+2.171
4.03%
jan 1, 2015
62.424
+6.385
11.39%
Ranking of countries by current statistics by years