Download This statistics in other country:
Timeline:
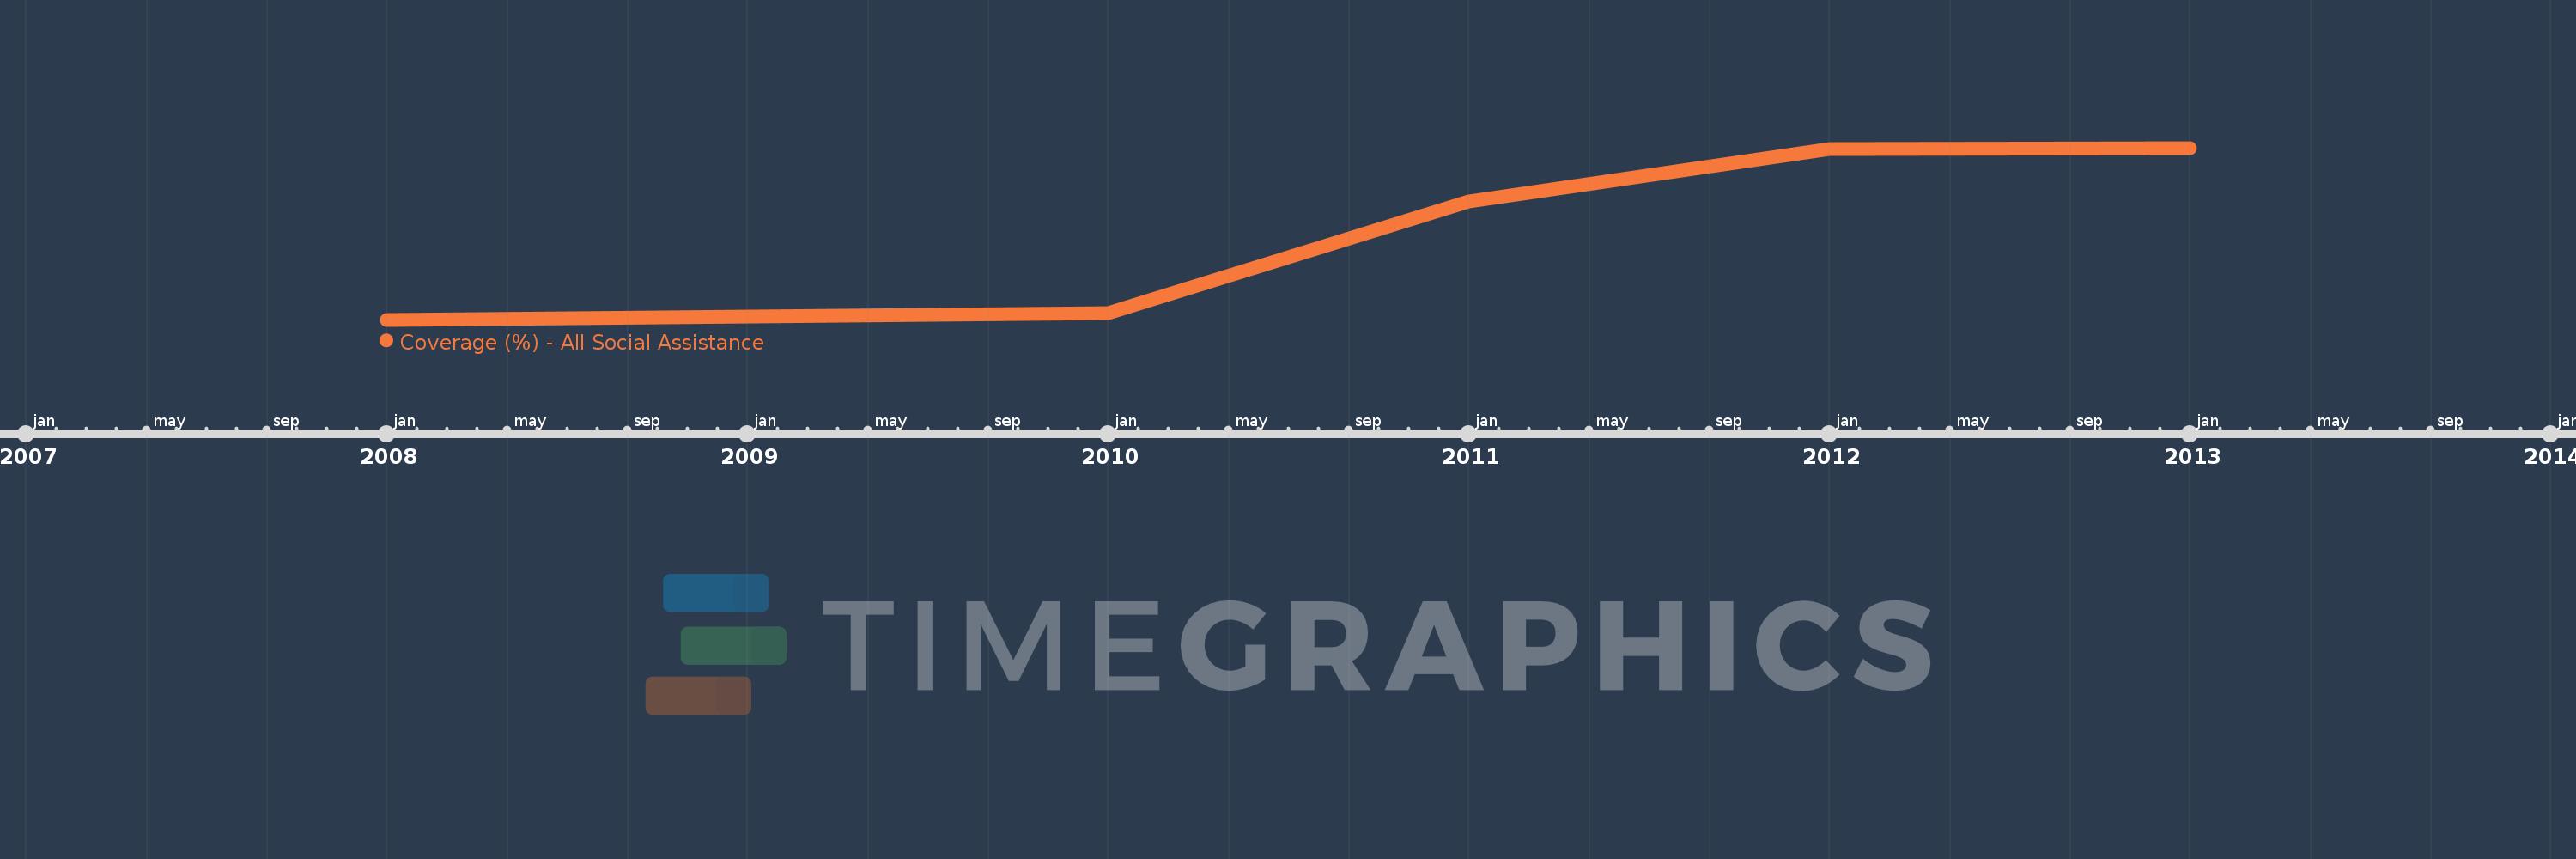
This timeline shows a graph from 2008 to 2013 of Mongolia. No data until 2007. Number of actual observations by date: 5.
Source name:
World Development Indicators
Source organization:
The Atlas of Social Protection: Indicators of Resilience and Equity (ASPIRE)
Categories, topics:
Social Protection & Labor
Last updated:
apr 23, 2017
Indicators value changes by year
Minimum:
83.239
jan 1, 2008
Maximum:
99.831
jan 1, 2013
At the date of observation
Value
Absolute change
Change from the previous value
jan 1, 2008
83.239
+83.239
0.0%
jan 1, 2010
83.861
+0.622
0.75%
jan 1, 2011
94.703
+10.841
12.93%
jan 1, 2012
99.684
+4.981
5.26%
jan 1, 2013
99.831
+0.147
0.15%
Ranking of countries by current statistics by years