Download This statistics in other country:
Timeline:
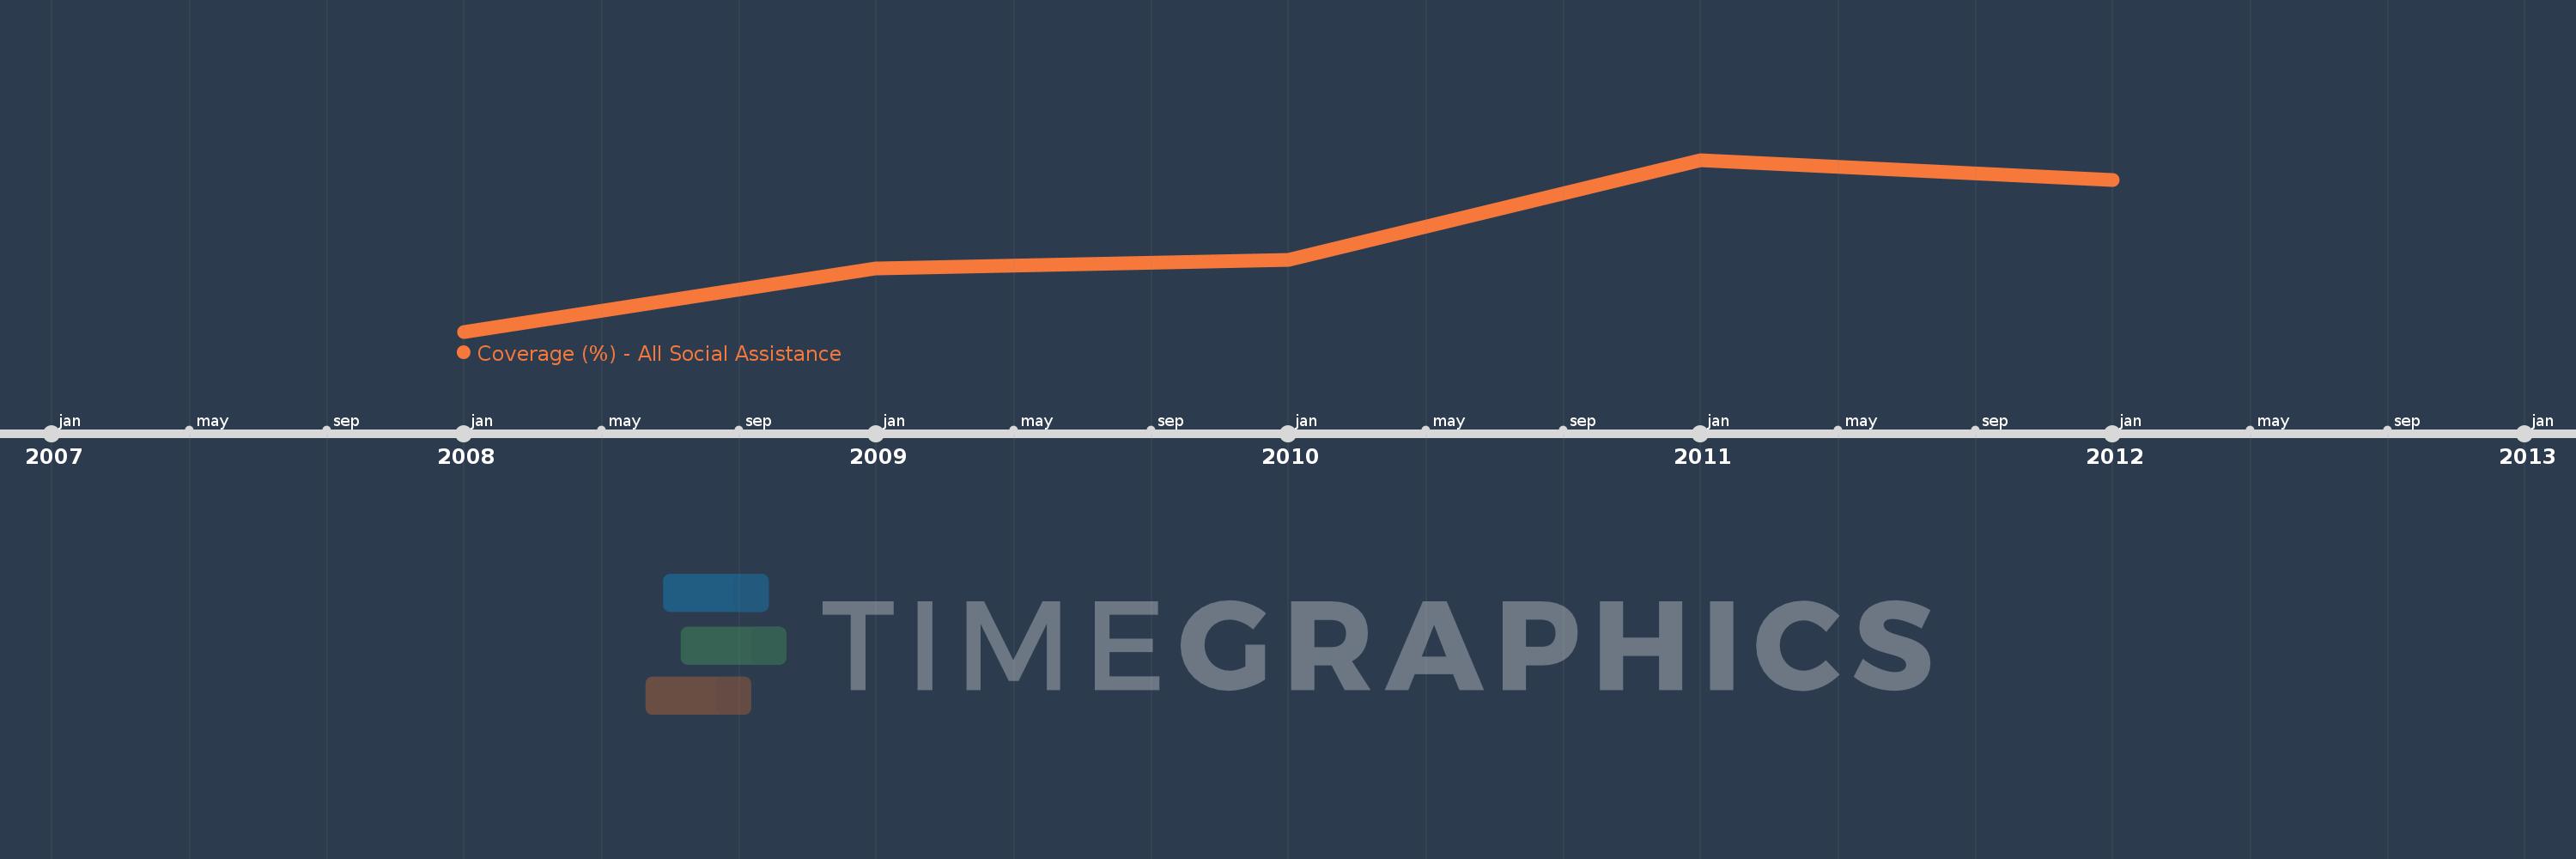
This timeline shows a graph from 2008 to 2012 of Paraguay. No data until 2007. Number of actual observations by date: 5.
Source name:
World Development Indicators
Source organization:
The Atlas of Social Protection: Indicators of Resilience and Equity (ASPIRE)
Categories, topics:
Social Protection & Labor
Last updated:
apr 23, 2017
Indicators value changes by year
Minimum:
32.724
jan 1, 2008
Maximum:
49.726
jan 1, 2011
At the date of observation
Value
Absolute change
Change from the previous value
jan 1, 2008
32.724
+32.724
0.0%
jan 1, 2009
38.948
+6.224
19.02%
jan 1, 2010
39.854
+0.906
2.33%
jan 1, 2011
49.726
+9.871
24.77%
jan 1, 2012
47.755
-1.971
-3.96%
Ranking of countries by current statistics by years