Download This statistics in other country:
Timeline:
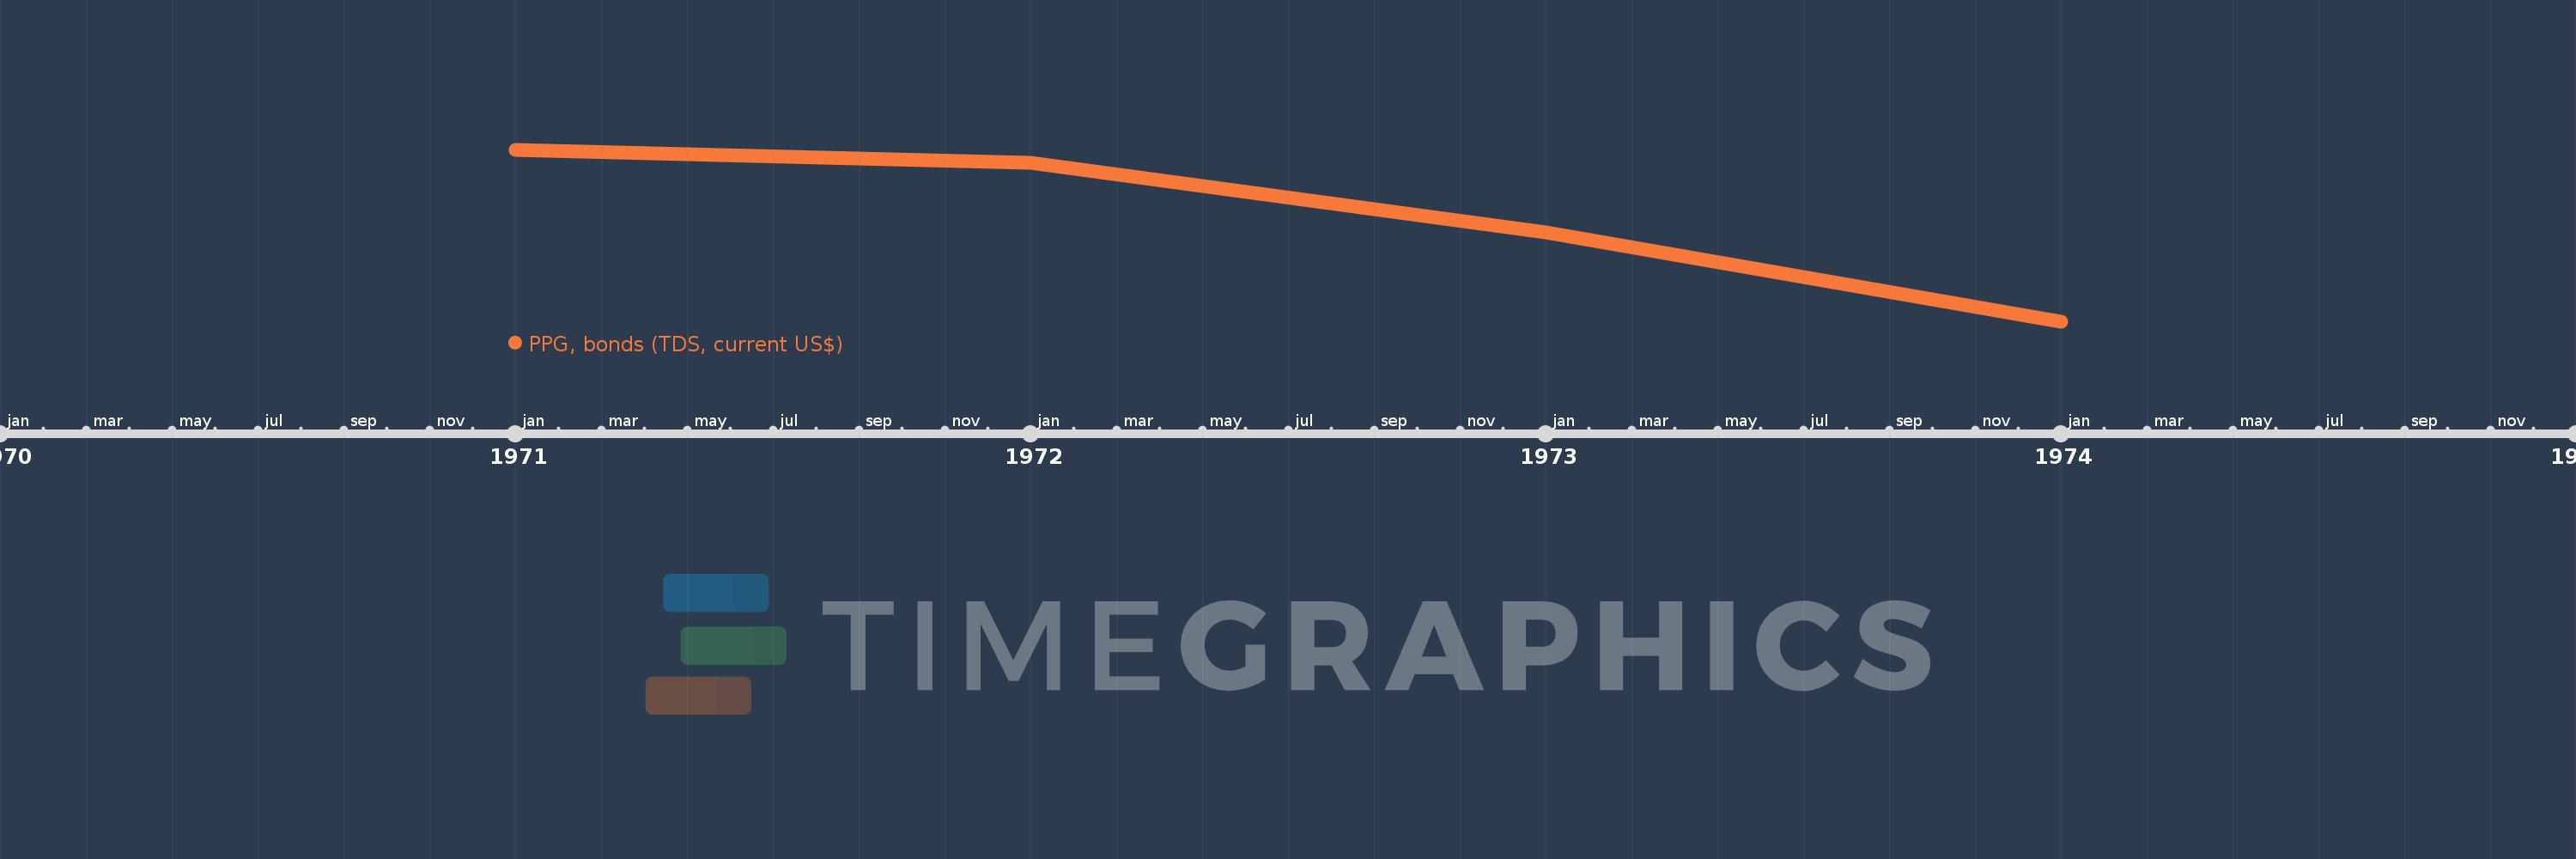
This timeline shows a graph from 1971 to 1974 of Sudan. No data until 1970. Number of actual observations by date: 4.
Source name:
World Development Indicators
Source organization:
World Bank, International Debt Statistics.
Categories, topics:
External Debt
Last updated:
apr 23, 2017
Indicators value changes by year
Minimum:
146.0K
jan 1, 1974
Maximum:
840.0K
jan 1, 1971
At the date of observation
Value
Absolute change
Change from the previous value
jan 1, 1971
840.0K
+840.0K
0.0%
jan 1, 1972
789.0K
-51.0K
-6.07%
jan 1, 1973
509.0K
-280.0K
-35.49%
jan 1, 1974
146.0K
-363.0K
-71.32%
Ranking of countries by current statistics by years