33
/
AIzaSyB4mHJ5NPEv-XzF7P6NDYXjlkCWaeKw5bc
November 30, 2025
246134
South Africa
ZAF
true
2
1
PPG, bonds (TDS, current US$)
2016,2015,2014,2013,2012,2011,2010,2009,2008,2007,2006,2005,2004,2003,2002,2001,2000,1999,1998,1997,1996,1995
Create a timeline
Public Timelines
For education
For educational institutions
For teachers
For students
Cabinet
For educational institutions
For teachers
For students
Open cabinet
FAQ
Close
Create a timeline
Public timelines
FAQ
About & Feedback
Terms
Privacy
FAQ
Support 24/7
Cabinet
Get premium
Donate
Download
Global statistics library
→
South Africa
→
PPG, bonds (TDS, current US$)
This statistics in other country:
Albania
Algeria
Angola
Argentina
Armenia
Azerbaijan
Belarus
Belize
Benin
Bolivia
Bosnia and Herzegovina
Botswana
Brazil
Bulgaria
Burkina Faso
Cameroon
China
Colombia
Congo, Dem. Rep.
Congo, Rep.
Costa Rica
Cote d'Ivoire
Dominica
Dominican Republic
East Asia & Pacific (excluding high income)
Ecuador
Egypt, Arab Rep.
El Salvador
Ethiopia
Europe & Central Asia (excluding high income)
Fiji
Gabon
Georgia
Ghana
Grenada
Guatemala
Guinea
Guyana
Honduras
IDA only
India
Indonesia
Jamaica
Jordan
Kazakhstan
Kenya
Lao PDR
Latin America & Caribbean (excluding high income)
Lebanon
Low & middle income
Low income
Lower middle income
Macedonia, FYR
Malawi
Malaysia
Mauritania
Mauritius
Mexico
Middle East & North Africa (excluding high income)
Middle income
Moldova
Mongolia
Montenegro
Morocco
Mozambique
Nicaragua
Niger
Nigeria
Pakistan
Panama
Papua New Guinea
Paraguay
Peru
Philippines
Romania
Russian Federation
Rwanda
Samoa
Senegal
Serbia
Sierra Leone
South Africa
South Asia
Sri Lanka
St. Lucia
St. Vincent and the Grenadines
Sub-Saharan Africa (excluding high income)
Sudan
Thailand
Togo
Tunisia
Turkey
Uganda
Ukraine
Upper middle income
Venezuela, RB
Vietnam
Zambia
Zimbabwe
Timeline:
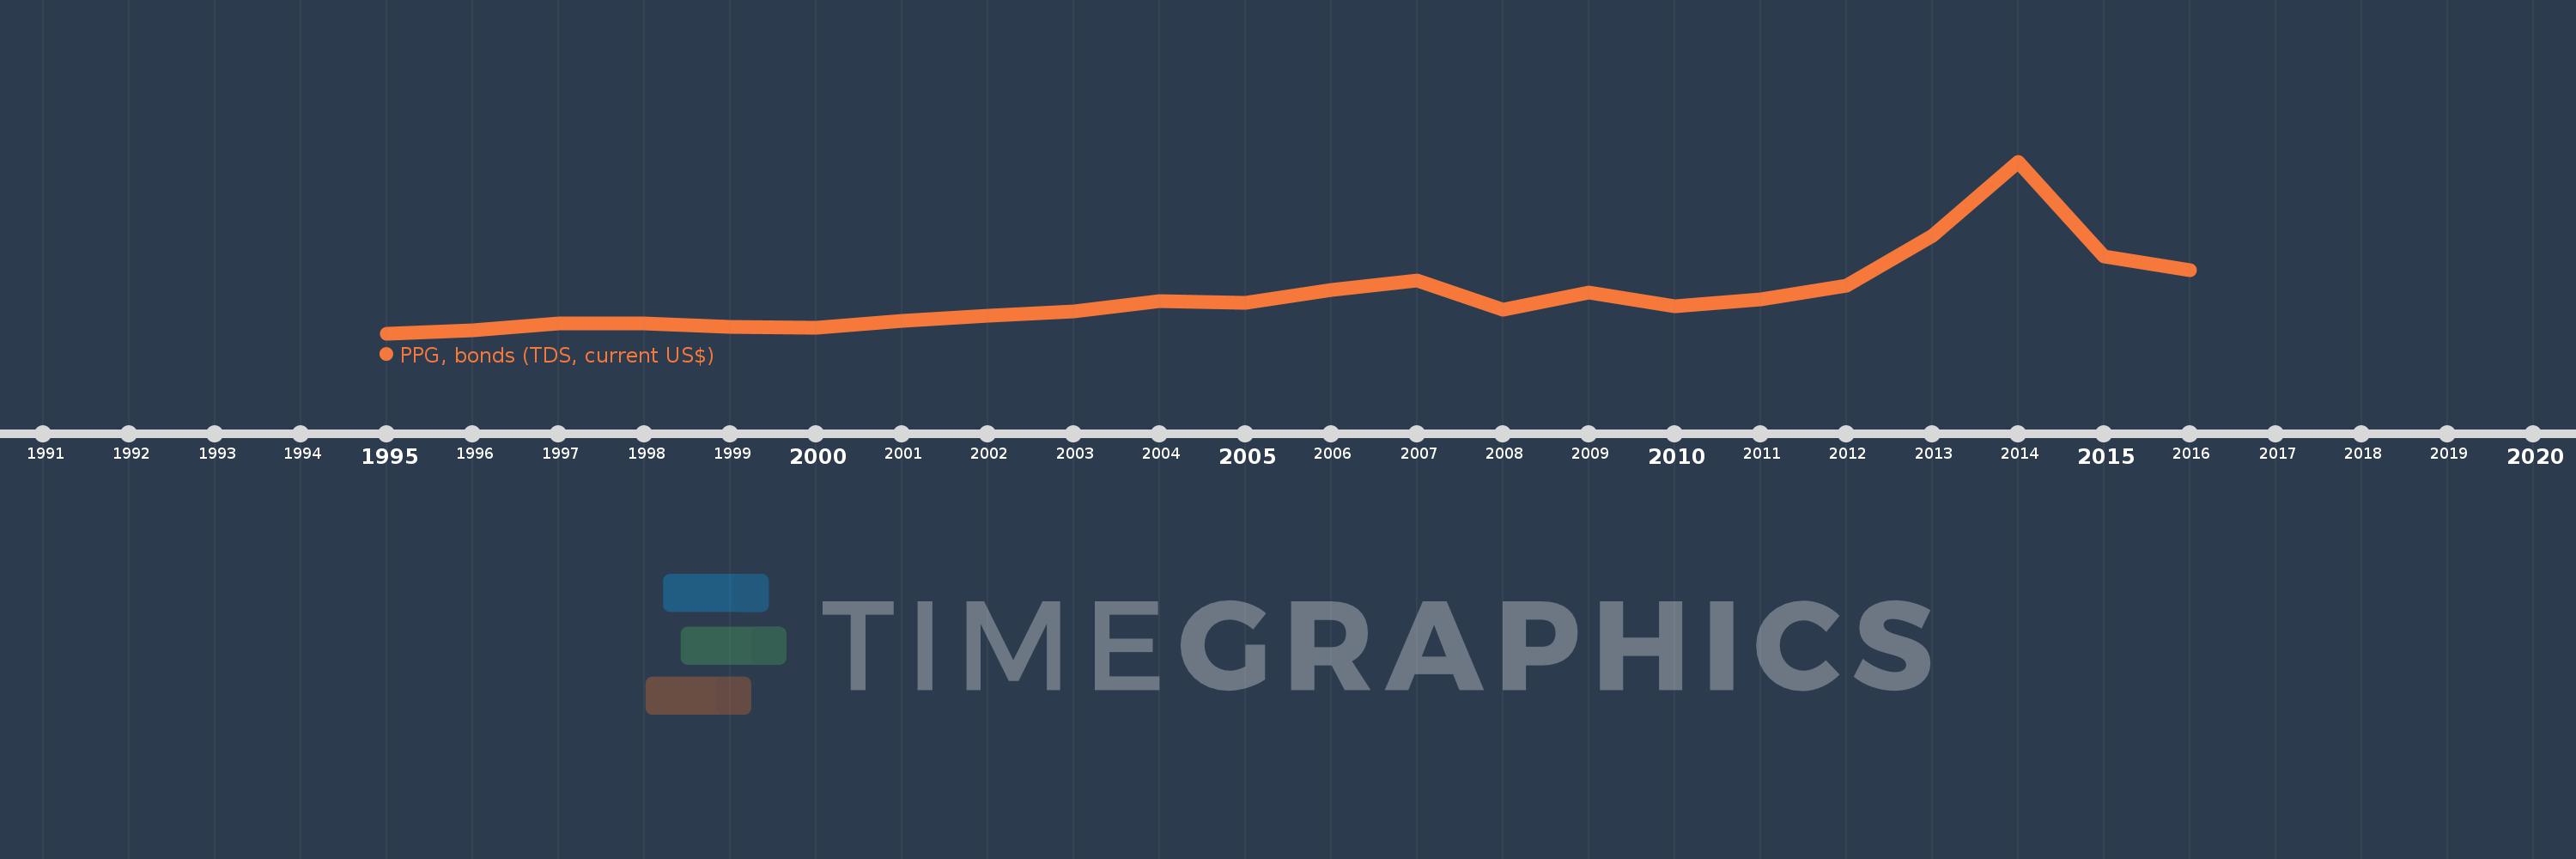
This timeline shows a graph from
1995
to
2016
of South Africa. No data until
1994
. Number of actual observations by date:
22
.
Source name:
World Development Indicators
Source organization:
World Bank, International Debt Statistics.
Categories, topics:
External Debt
Last updated:
apr 23, 2017
Indicators value changes by year
Meaning:
1.639 bln
Minimum:
62.513 mln
jan 1, 1995
Maximum:
7.249 bln
jan 1, 2014
At the date of observation
Value
Absolute change
Change from the previous value
jan 1, 1995
62.513 mln
+62.513 mln
0.0%
jan 1, 1996
198.246 mln
+135.733 mln
217.13%
jan 1, 1997
459.761 mln
+261.515 mln
131.91%
jan 1, 1998
459.667 mln
-94.0K
-0.02%
jan 1, 1999
338.103 mln
-121.564 mln
-26.45%
jan 1, 2000
286.121 mln
-51.982 mln
-15.37%
jan 1, 2001
584.472 mln
+298.351 mln
104.27%
jan 1, 2002
796.125 mln
+211.653 mln
36.21%
jan 1, 2003
978.666 mln
+182.541 mln
22.93%
jan 1, 2004
1.416 bln
+437.524 mln
44.71%
jan 1, 2005
1.327 bln
-89.111 mln
-6.29%
jan 1, 2006
1.861 bln
+534.108 mln
40.25%
jan 1, 2007
2.287 bln
+425.766 mln
22.88%
jan 1, 2008
1.06 bln
-1.227 bln
-53.65%
jan 1, 2009
1.783 bln
+722.586 mln
68.17%
jan 1, 2010
1.203 bln
-579.702 mln
-32.52%
jan 1, 2011
1.488 bln
+285.295 mln
23.72%
jan 1, 2012
2.072 bln
+584.243 mln
39.26%
jan 1, 2013
4.145 bln
+2.072 bln
99.99%
jan 1, 2014
7.249 bln
+3.104 bln
74.9%
jan 1, 2015
3.276 bln
-3.973 bln
-54.8%
jan 1, 2016
2.72 bln
-556.273 mln
-16.98%
Ranking of countries by current statistics by years
About & Feedback
Terms
Privacy
FAQ
Support 24/7
Cabinet
Get premium
Donate
The service accepts bank transfer (ACH, Wire) or cards (Visa, MasterCard, etc). Processed by Stripe.
Secured with SSL