33
/
AIzaSyB4mHJ5NPEv-XzF7P6NDYXjlkCWaeKw5bc
November 30, 2025
122686
Dominican Republic
DOM
true
2
1
PPG, bonds (TDS, current US$)
2016,2015,2014,2013,2012,2011,2010,2009,2008,2007,2006,2005,2004,2003,2002,2001,2000,1999,1998,1997,1996,1995
Create a timeline
Public Timelines
For education
For educational institutions
For teachers
For students
Cabinet
For educational institutions
For teachers
For students
Open cabinet
FAQ
Close
Create a timeline
Public timelines
FAQ
About & Feedback
Terms
Privacy
FAQ
Support 24/7
Cabinet
Get premium
Donate
Download
Global statistics library
→
Dominican Republic
→
PPG, bonds (TDS, current US$)
This statistics in other country:
Albania
Algeria
Angola
Argentina
Armenia
Azerbaijan
Belarus
Belize
Benin
Bolivia
Bosnia and Herzegovina
Botswana
Brazil
Bulgaria
Burkina Faso
Cameroon
China
Colombia
Congo, Dem. Rep.
Congo, Rep.
Costa Rica
Cote d'Ivoire
Dominica
Dominican Republic
East Asia & Pacific (excluding high income)
Ecuador
Egypt, Arab Rep.
El Salvador
Ethiopia
Europe & Central Asia (excluding high income)
Fiji
Gabon
Georgia
Ghana
Grenada
Guatemala
Guinea
Guyana
Honduras
IDA only
India
Indonesia
Jamaica
Jordan
Kazakhstan
Kenya
Lao PDR
Latin America & Caribbean (excluding high income)
Lebanon
Low & middle income
Low income
Lower middle income
Macedonia, FYR
Malawi
Malaysia
Mauritania
Mauritius
Mexico
Middle East & North Africa (excluding high income)
Middle income
Moldova
Mongolia
Montenegro
Morocco
Mozambique
Nicaragua
Niger
Nigeria
Pakistan
Panama
Papua New Guinea
Paraguay
Peru
Philippines
Romania
Russian Federation
Rwanda
Samoa
Senegal
Serbia
Sierra Leone
South Africa
South Asia
Sri Lanka
St. Lucia
St. Vincent and the Grenadines
Sub-Saharan Africa (excluding high income)
Sudan
Thailand
Togo
Tunisia
Turkey
Uganda
Ukraine
Upper middle income
Venezuela, RB
Vietnam
Zambia
Zimbabwe
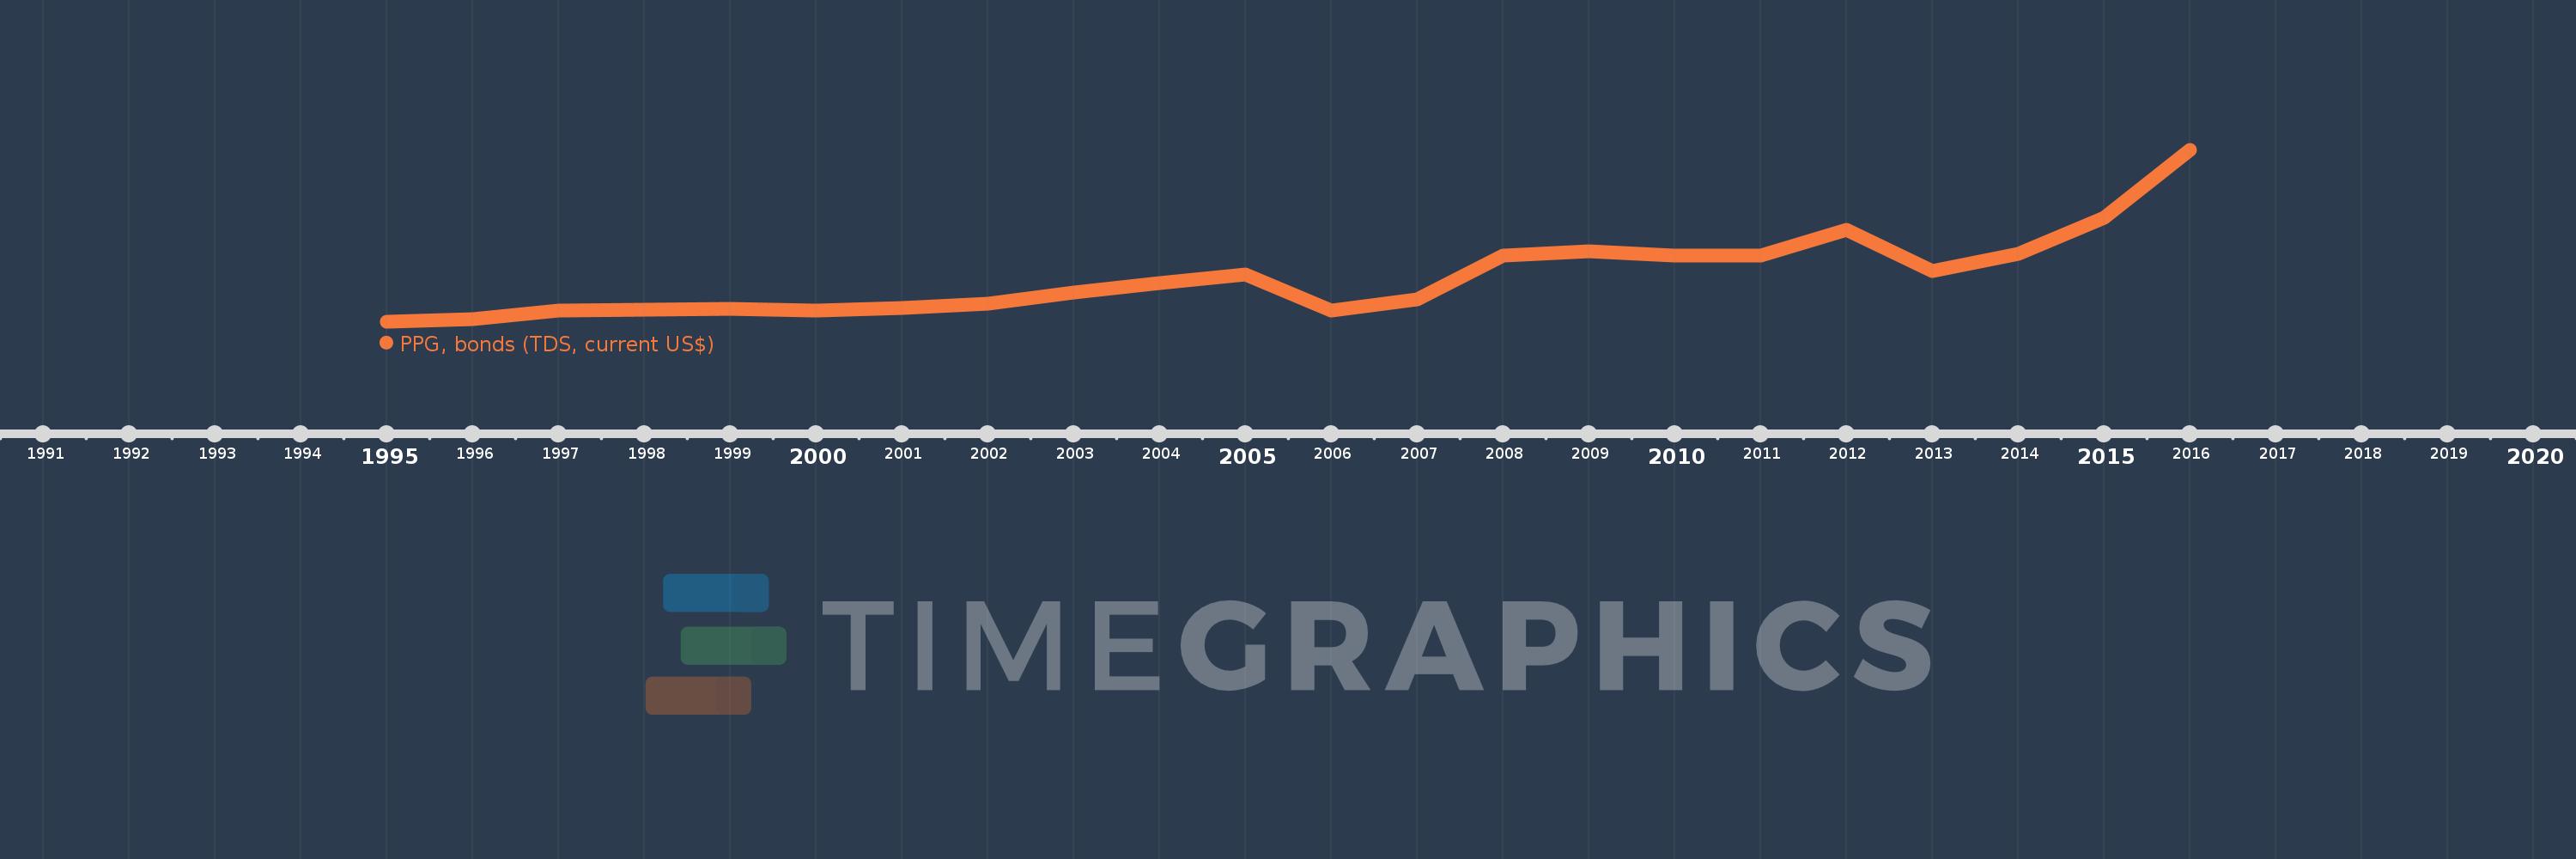
Timeline:
This timeline shows a graph from
1995
to
2016
of Dominican Republic. No data until
1994
. Number of actual observations by date:
22
.
Source name:
World Development Indicators
Source organization:
World Bank, International Debt Statistics.
Categories, topics:
External Debt
Last updated:
apr 23, 2017
Indicators value changes by year
Meaning:
124.119 mln
Minimum:
4.826 mln
jan 1, 1995
Maximum:
459.418 mln
jan 1, 2016
At the date of observation
Value
Absolute change
Change from the previous value
jan 1, 1995
4.826 mln
+4.826 mln
0.0%
jan 1, 1996
12.518 mln
+7.692 mln
159.39%
jan 1, 1997
34.17 mln
+21.652 mln
172.97%
jan 1, 1998
36.499 mln
+2.329 mln
6.82%
jan 1, 1999
39.119 mln
+2.62 mln
7.18%
jan 1, 2000
35.825 mln
-3.294 mln
-8.42%
jan 1, 2001
41.351 mln
+5.526 mln
15.42%
jan 1, 2002
52.49 mln
+11.139 mln
26.94%
jan 1, 2003
82.796 mln
+30.306 mln
57.74%
jan 1, 2004
106.848 mln
+24.052 mln
29.05%
jan 1, 2005
131.645 mln
+24.797 mln
23.21%
jan 1, 2006
36.095 mln
-95.55 mln
-72.58%
jan 1, 2007
65.15 mln
+29.055 mln
80.5%
jan 1, 2008
181.497 mln
+116.347 mln
178.58%
jan 1, 2009
191.966 mln
+10.469 mln
5.77%
jan 1, 2010
180.582 mln
-11.384 mln
-5.93%
jan 1, 2011
181.601 mln
+1.019 mln
0.56%
jan 1, 2012
249.254 mln
+67.653 mln
37.25%
jan 1, 2013
140.128 mln
-109.126 mln
-43.78%
jan 1, 2014
185.562 mln
+45.434 mln
32.42%
jan 1, 2015
281.27 mln
+95.708 mln
51.58%
jan 1, 2016
459.418 mln
+178.148 mln
63.34%
Ranking of countries by current statistics by years
About & Feedback
Terms
Privacy
FAQ
Support 24/7
Cabinet
Get premium
Donate
The service accepts bank transfer (ACH, Wire) or cards (Visa, MasterCard, etc). Processed by Stripe.
Secured with SSL