33
/
AIzaSyB4mHJ5NPEv-XzF7P6NDYXjlkCWaeKw5bc
November 30, 2025
176923
Lebanon
LBN
true
2
1
PPG, bonds (TDS, current US$)
2016,2015,2014,2013,2012,2011,2010,2009,2008,2007,2006,2005,2004,2003,2002,2001,2000,1999,1998,1997,1996
Create a timeline
Public Timelines
For education
For educational institutions
For teachers
For students
Cabinet
For educational institutions
For teachers
For students
Open cabinet
FAQ
Close
Create a timeline
Public timelines
FAQ
About & Feedback
Terms
Privacy
FAQ
Support 24/7
Cabinet
Get premium
Donate
Download
Global statistics library
→
Lebanon
→
PPG, bonds (TDS, current US$)
This statistics in other country:
Albania
Algeria
Angola
Argentina
Armenia
Azerbaijan
Belarus
Belize
Benin
Bolivia
Bosnia and Herzegovina
Botswana
Brazil
Bulgaria
Burkina Faso
Cameroon
China
Colombia
Congo, Dem. Rep.
Congo, Rep.
Costa Rica
Cote d'Ivoire
Dominica
Dominican Republic
East Asia & Pacific (excluding high income)
Ecuador
Egypt, Arab Rep.
El Salvador
Ethiopia
Europe & Central Asia (excluding high income)
Fiji
Gabon
Georgia
Ghana
Grenada
Guatemala
Guinea
Guyana
Honduras
IDA only
India
Indonesia
Jamaica
Jordan
Kazakhstan
Kenya
Lao PDR
Latin America & Caribbean (excluding high income)
Lebanon
Low & middle income
Low income
Lower middle income
Macedonia, FYR
Malawi
Malaysia
Mauritania
Mauritius
Mexico
Middle East & North Africa (excluding high income)
Middle income
Moldova
Mongolia
Montenegro
Morocco
Mozambique
Nicaragua
Niger
Nigeria
Pakistan
Panama
Papua New Guinea
Paraguay
Peru
Philippines
Romania
Russian Federation
Rwanda
Samoa
Senegal
Serbia
Sierra Leone
South Africa
South Asia
Sri Lanka
St. Lucia
St. Vincent and the Grenadines
Sub-Saharan Africa (excluding high income)
Sudan
Thailand
Togo
Tunisia
Turkey
Uganda
Ukraine
Upper middle income
Venezuela, RB
Vietnam
Zambia
Zimbabwe
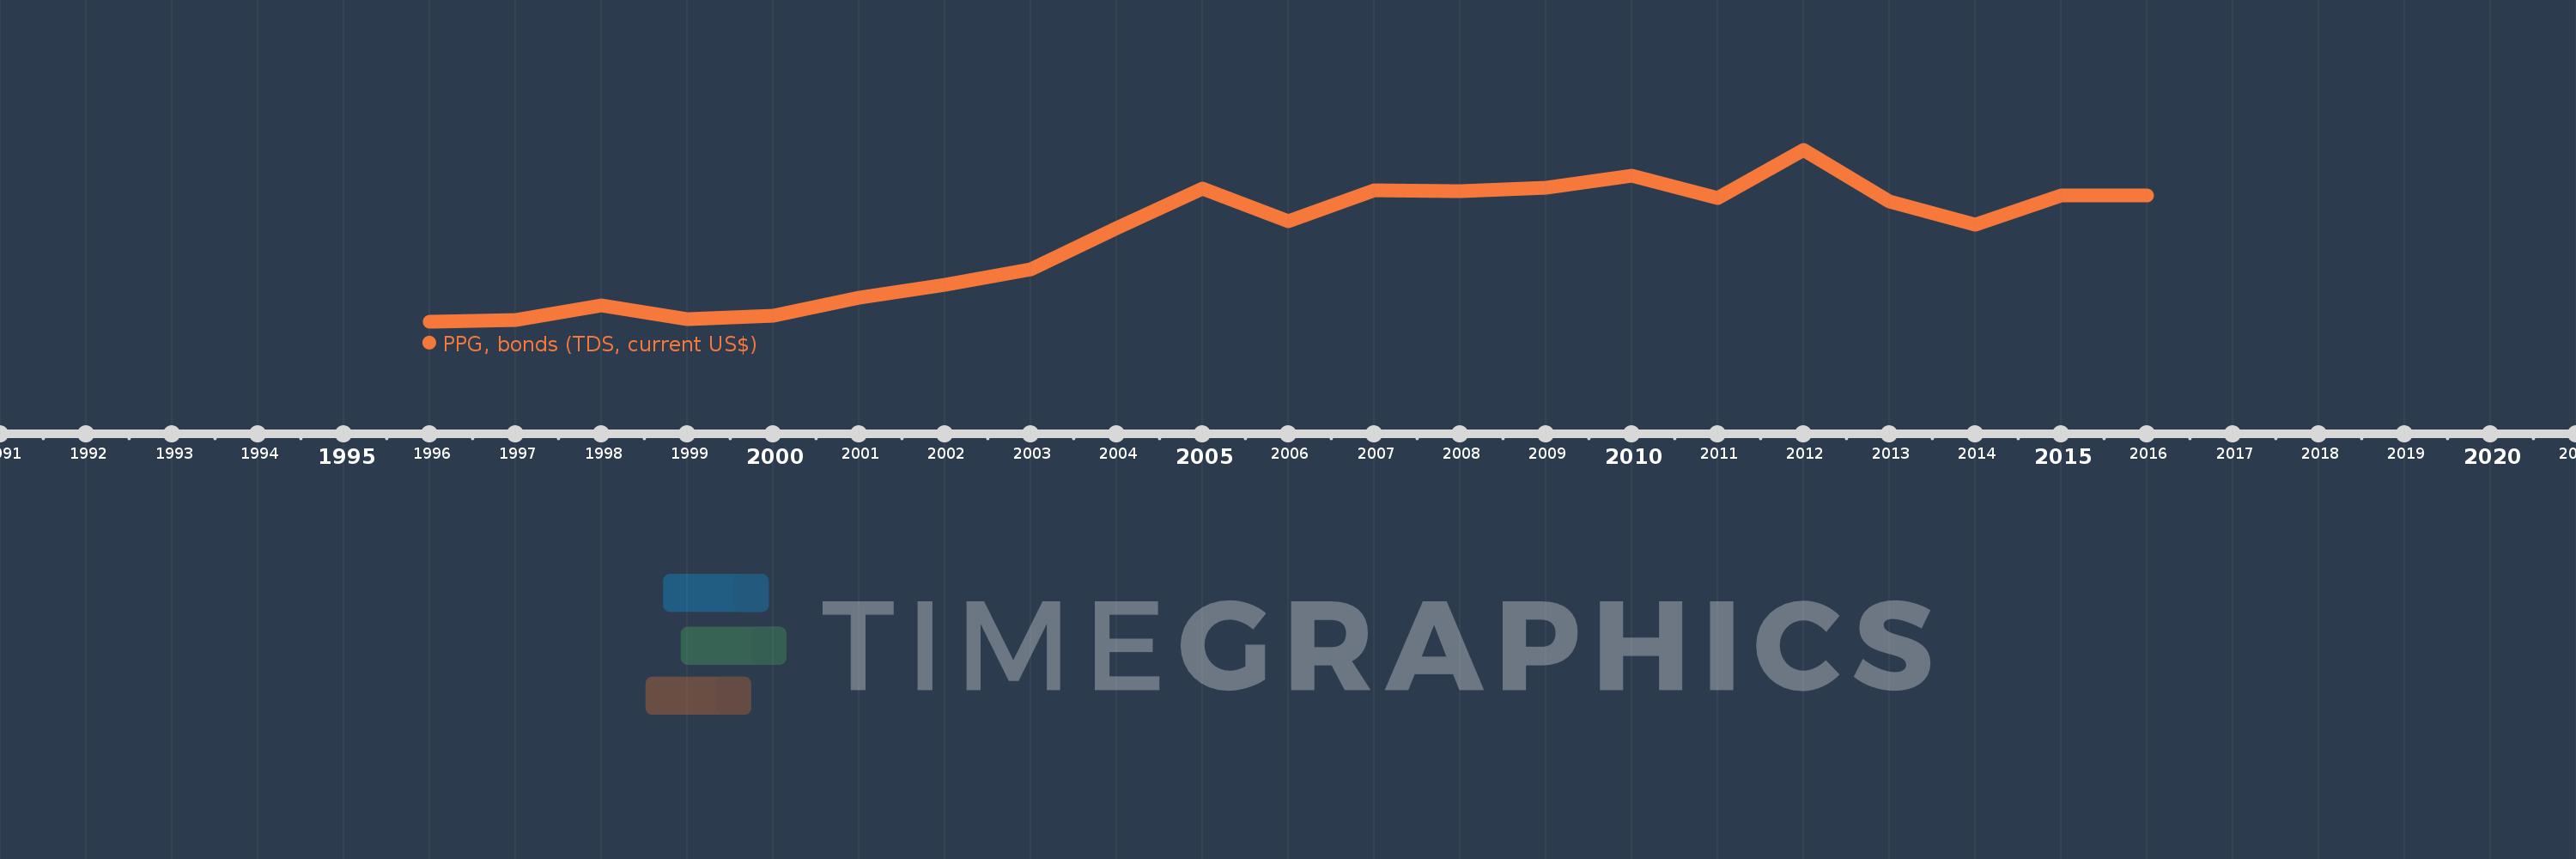
Timeline:
This timeline shows a graph from
1996
to
2016
of Lebanon. No data until
1995
. Number of actual observations by date:
21
.
Source name:
World Development Indicators
Source organization:
World Bank, International Debt Statistics.
Categories, topics:
External Debt
Last updated:
apr 23, 2017
Indicators value changes by year
Meaning:
2.351 bln
Minimum:
20.25 mln
jan 1, 1996
Maximum:
4.744 bln
jan 1, 2012
At the date of observation
Value
Absolute change
Change from the previous value
jan 1, 1996
20.25 mln
+20.25 mln
0.0%
jan 1, 1997
72.14 mln
+51.89 mln
256.25%
jan 1, 1998
480.678 mln
+408.538 mln
566.31%
jan 1, 1999
99.225 mln
-381.453 mln
-79.36%
jan 1, 2000
190.815 mln
+91.59 mln
92.31%
jan 1, 2001
699.713 mln
+508.898 mln
266.7%
jan 1, 2002
1.036 bln
+336.486 mln
48.09%
jan 1, 2003
1.465 bln
+428.803 mln
41.38%
jan 1, 2004
2.596 bln
+1.131 bln
77.17%
jan 1, 2005
3.693 bln
+1.097 bln
42.28%
jan 1, 2006
2.781 bln
-911.497 mln
-24.68%
jan 1, 2007
3.652 bln
+870.306 mln
31.29%
jan 1, 2008
3.62 bln
-31.261 mln
-0.86%
jan 1, 2009
3.709 bln
+88.478 mln
2.44%
jan 1, 2010
4.034 bln
+325.267 mln
8.77%
jan 1, 2011
3.439 bln
-594.646 mln
-14.74%
jan 1, 2012
4.744 bln
+1.305 bln
37.93%
jan 1, 2013
3.324 bln
-1.421 bln
-29.95%
jan 1, 2014
2.704 bln
-619.562 mln
-18.64%
jan 1, 2015
3.495 bln
+790.764 mln
29.24%
jan 1, 2016
3.508 bln
+13.412 mln
0.38%
Ranking of countries by current statistics by years
About & Feedback
Terms
Privacy
FAQ
Support 24/7
Cabinet
Get premium
Donate
The service accepts bank transfer (ACH, Wire) or cards (Visa, MasterCard, etc). Processed by Stripe.
Secured with SSL