33
/
AIzaSyB4mHJ5NPEv-XzF7P6NDYXjlkCWaeKw5bc
November 30, 2025
229015
Romania
ROU
true
2
1
PPG, bonds (TDS, current US$)
2016,2015,2014,2013,2012,2011,2010,2009,2008,2007,2006,2005,2004,2003,2002,2001,2000,1999,1998,1997
Create a timeline
Public Timelines
For education
For educational institutions
For teachers
For students
Cabinet
For educational institutions
For teachers
For students
Open cabinet
FAQ
Close
Create a timeline
Public timelines
FAQ
About & Feedback
Terms
Privacy
FAQ
Support 24/7
Cabinet
Get premium
Donate
Download
Global statistics library
→
Romania
→
PPG, bonds (TDS, current US$)
This statistics in other country:
Albania
Algeria
Angola
Argentina
Armenia
Azerbaijan
Belarus
Belize
Benin
Bolivia
Bosnia and Herzegovina
Botswana
Brazil
Bulgaria
Burkina Faso
Cameroon
China
Colombia
Congo, Dem. Rep.
Congo, Rep.
Costa Rica
Cote d'Ivoire
Dominica
Dominican Republic
East Asia & Pacific (excluding high income)
Ecuador
Egypt, Arab Rep.
El Salvador
Ethiopia
Europe & Central Asia (excluding high income)
Fiji
Gabon
Georgia
Ghana
Grenada
Guatemala
Guinea
Guyana
Honduras
IDA only
India
Indonesia
Jamaica
Jordan
Kazakhstan
Kenya
Lao PDR
Latin America & Caribbean (excluding high income)
Lebanon
Low & middle income
Low income
Lower middle income
Macedonia, FYR
Malawi
Malaysia
Mauritania
Mauritius
Mexico
Middle East & North Africa (excluding high income)
Middle income
Moldova
Mongolia
Montenegro
Morocco
Mozambique
Nicaragua
Niger
Nigeria
Pakistan
Panama
Papua New Guinea
Paraguay
Peru
Philippines
Romania
Russian Federation
Rwanda
Samoa
Senegal
Serbia
Sierra Leone
South Africa
South Asia
Sri Lanka
St. Lucia
St. Vincent and the Grenadines
Sub-Saharan Africa (excluding high income)
Sudan
Thailand
Togo
Tunisia
Turkey
Uganda
Ukraine
Upper middle income
Venezuela, RB
Vietnam
Zambia
Zimbabwe
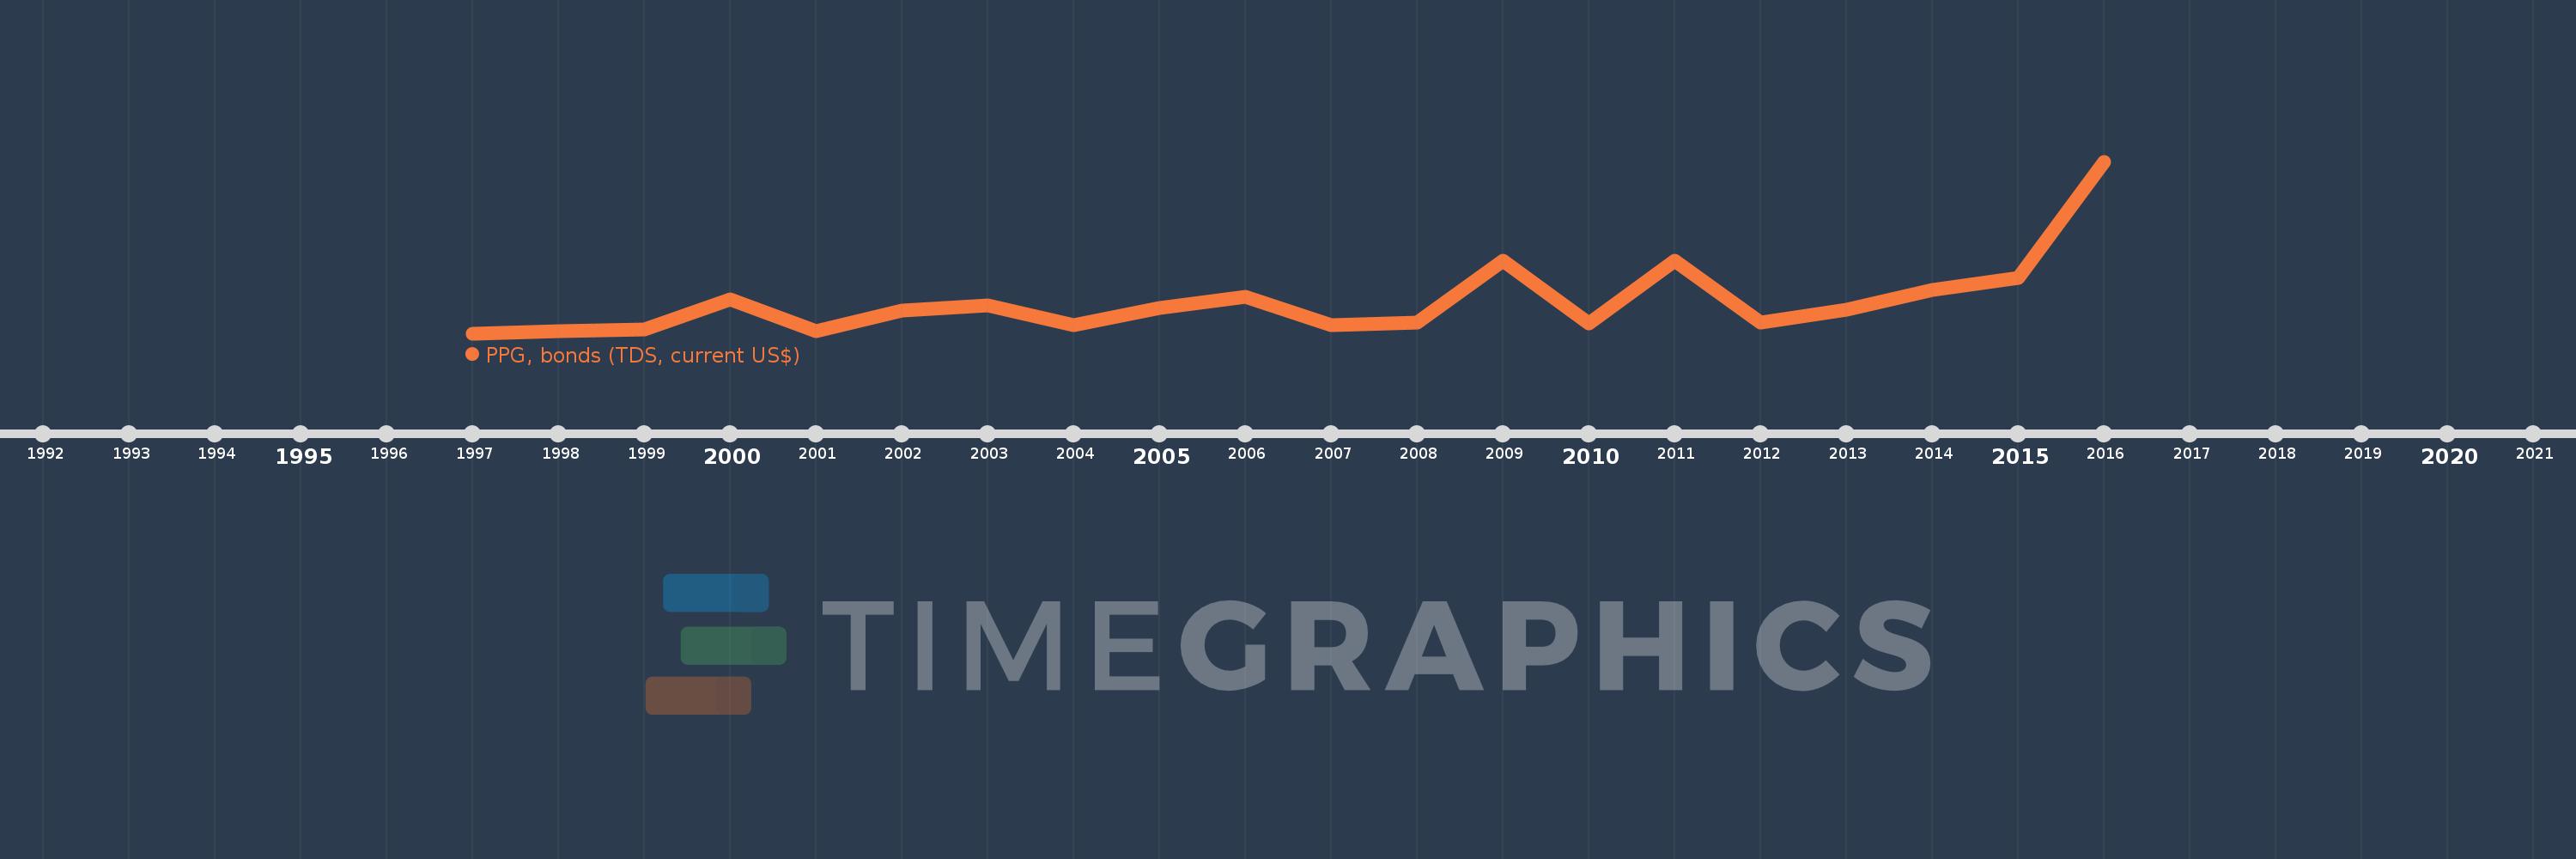
Timeline:
This timeline shows a graph from
1997
to
2016
of Romania. No data until
1996
. Number of actual observations by date:
20
.
Source name:
World Development Indicators
Source organization:
World Bank, International Debt Statistics.
Categories, topics:
External Debt
Last updated:
apr 23, 2017
Indicators value changes by year
Meaning:
485.149 mln
Minimum:
8.613 mln
jan 1, 1997
Maximum:
2.565 bln
jan 1, 2016
At the date of observation
Value
Absolute change
Change from the previous value
jan 1, 1997
8.613 mln
+8.613 mln
0.0%
jan 1, 1998
38.818 mln
+30.205 mln
350.69%
jan 1, 1999
62.955 mln
+24.137 mln
62.18%
jan 1, 2000
510.819 mln
+447.864 mln
711.4%
jan 1, 2001
45.45 mln
-465.369 mln
-91.1%
jan 1, 2002
345.205 mln
+299.755 mln
659.53%
jan 1, 2003
420.904 mln
+75.699 mln
21.93%
jan 1, 2004
130.979 mln
-289.925 mln
-68.88%
jan 1, 2005
379.791 mln
+248.812 mln
189.96%
jan 1, 2006
557.475 mln
+177.684 mln
46.78%
jan 1, 2007
130.588 mln
-426.887 mln
-76.58%
jan 1, 2008
170.815 mln
+40.227 mln
30.8%
jan 1, 2009
1.082 bln
+911.632 mln
533.7%
jan 1, 2010
155.819 mln
-926.628 mln
-85.6%
jan 1, 2011
1.085 bln
+928.916 mln
596.15%
jan 1, 2012
170.52 mln
-914.215 mln
-84.28%
jan 1, 2013
361.929 mln
+191.409 mln
112.25%
jan 1, 2014
648.278 mln
+286.349 mln
79.12%
jan 1, 2015
831.692 mln
+183.414 mln
28.29%
jan 1, 2016
2.565 bln
+1.733 bln
208.43%
Ranking of countries by current statistics by years
About & Feedback
Terms
Privacy
FAQ
Support 24/7
Cabinet
Get premium
Donate
The service accepts bank transfer (ACH, Wire) or cards (Visa, MasterCard, etc). Processed by Stripe.
Secured with SSL