Download This statistics in other country:
Timeline:
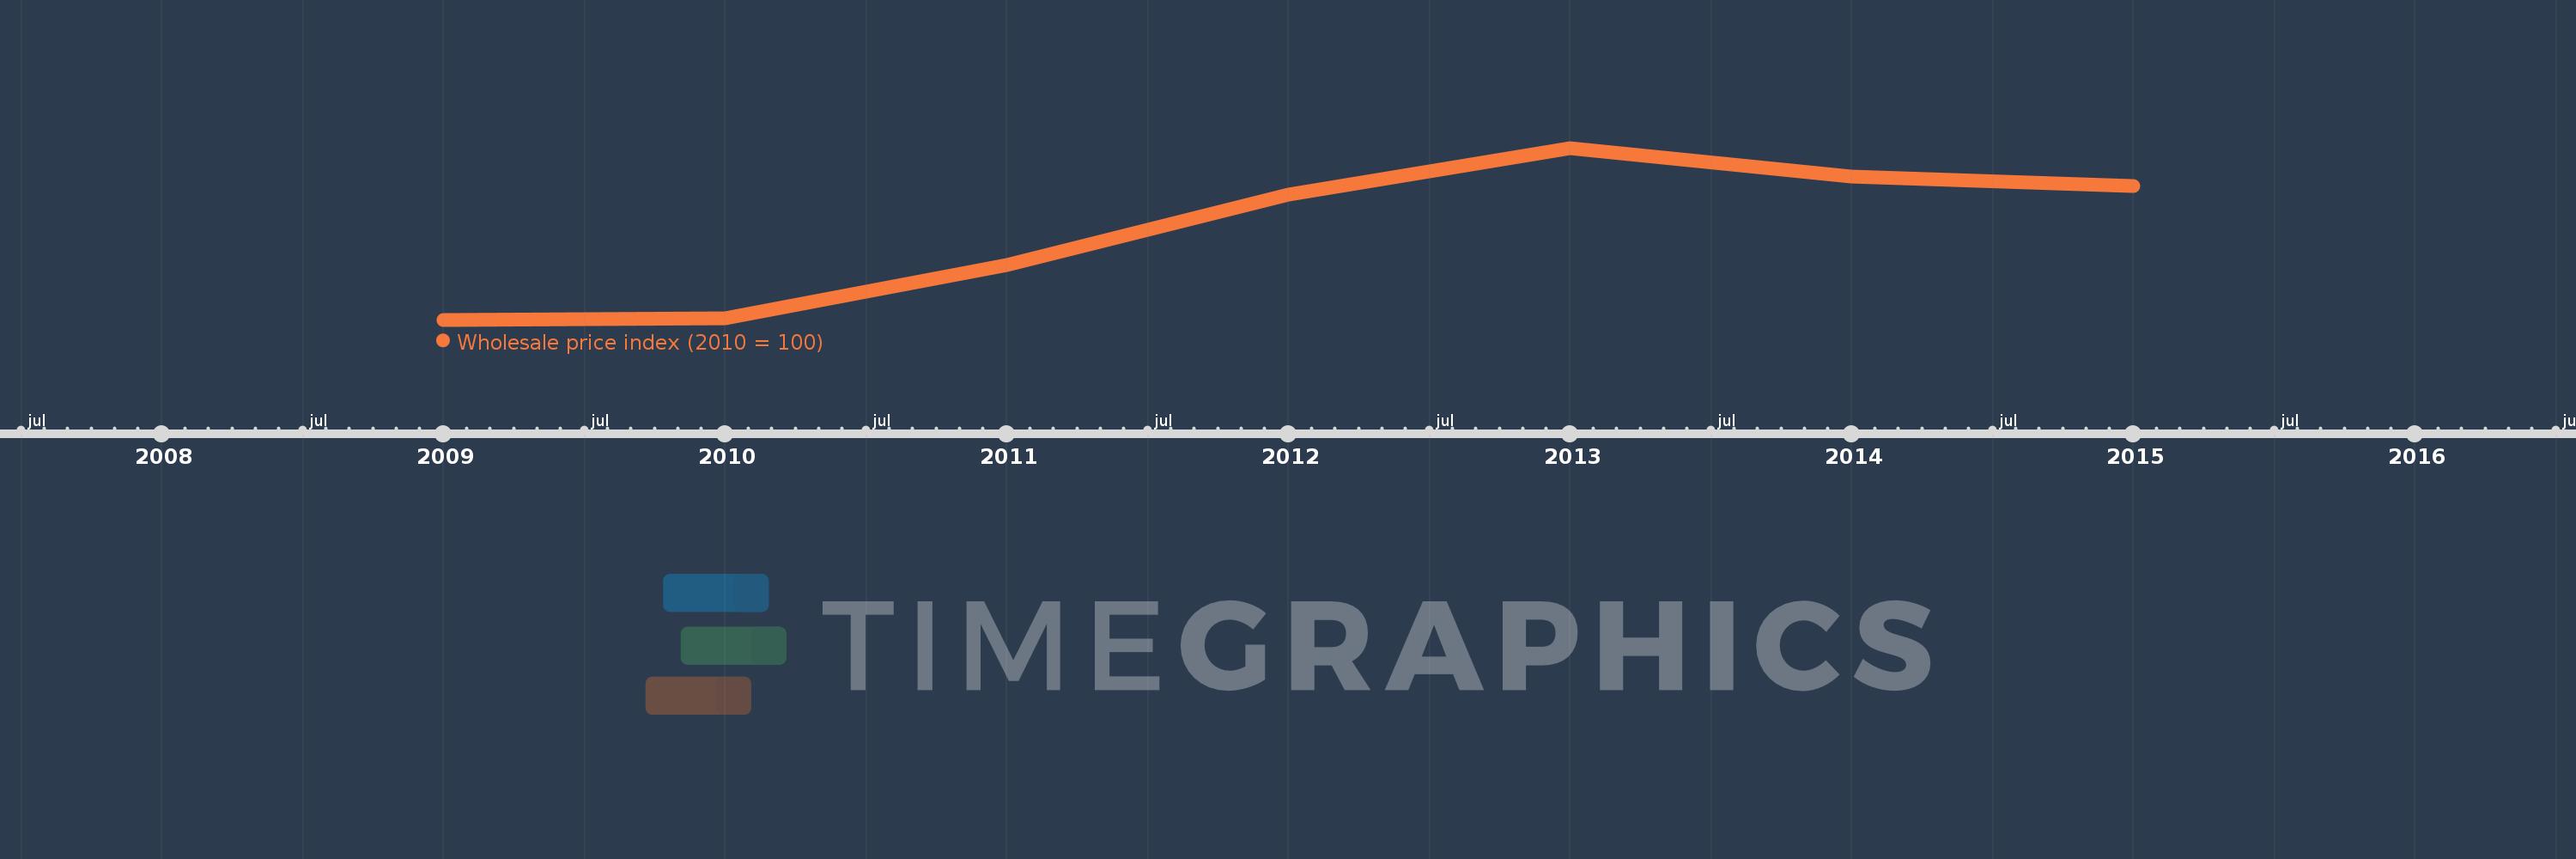
This timeline shows a graph from 2009 to 2015 of Senegal. No data until 2008. Number of actual observations by date: 7.
Source name:
World Development Indicators
Source organization:
International Monetary Fund, International Financial Statistics and data files.
Categories, topics:
Financial Sector
Last updated:
apr 23, 2017
Indicators value changes by year
At the date of observation
Value
Absolute change
Change from the previous value
jan 1, 2009
94.13
+94.13
0.0%
jan 1, 2010
94.245
+0.115
0.12%
jan 1, 2011
100.0
+5.755
6.11%
jan 1, 2012
107.553
+7.553
7.55%
jan 1, 2013
112.5
+4.947
4.6%
jan 1, 2014
109.47
-3.029
-2.69%
jan 1, 2015
108.432
-1.038
-0.95%
Ranking of countries by current statistics by years