Download This statistics in other country:
Timeline:
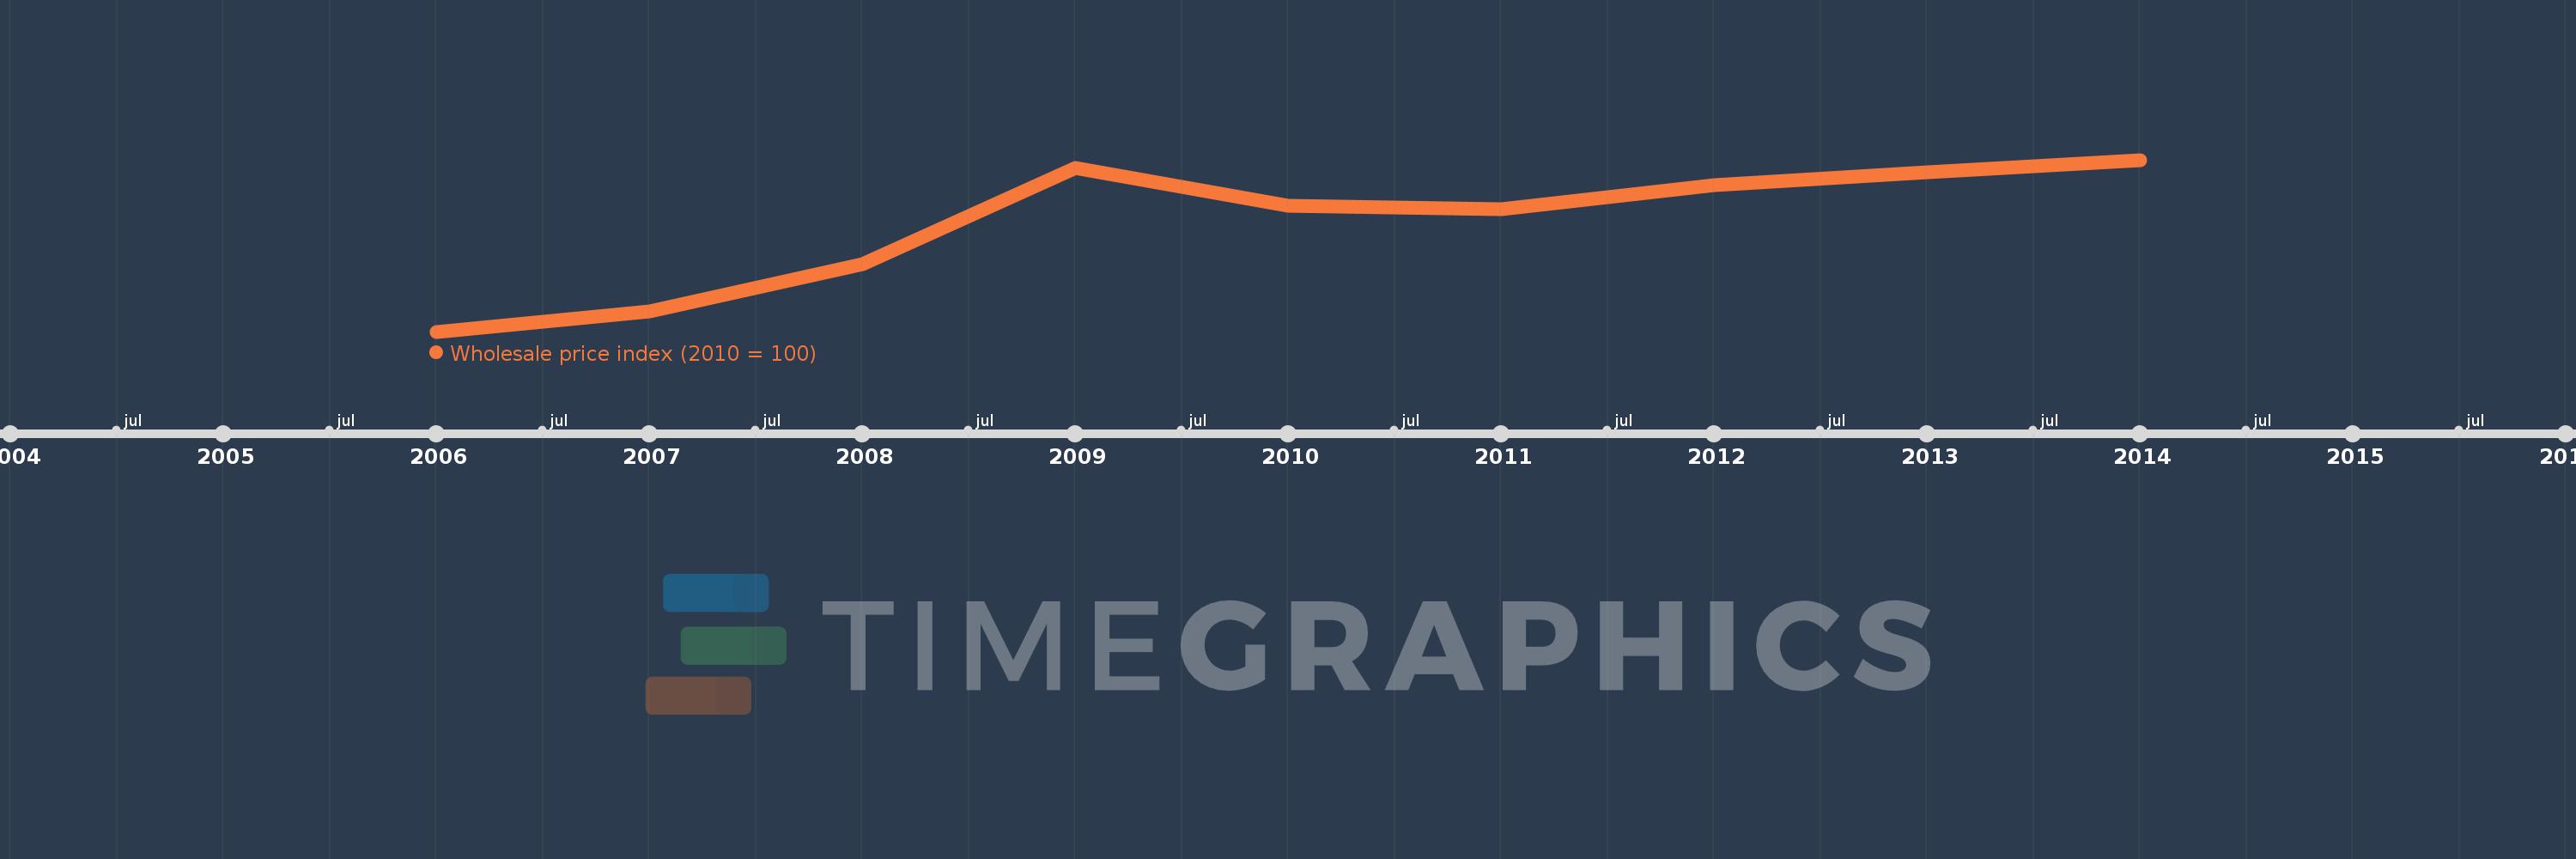
This timeline shows a graph from 2006 to 2014 of Montenegro. No data until 2005. Number of actual observations by date: 9.
Source name:
World Development Indicators
Source organization:
International Monetary Fund, International Financial Statistics and data files.
Categories, topics:
Financial Sector
Last updated:
apr 23, 2017
Indicators value changes by year
Minimum:
81.209
jan 1, 2006
Maximum:
107.568
jan 1, 2014
At the date of observation
Value
Absolute change
Change from the previous value
jan 1, 2006
81.209
+81.209
0.0%
jan 1, 2007
84.255
+3.046
3.75%
jan 1, 2008
91.606
+7.351
8.72%
jan 1, 2009
106.295
+14.689
16.03%
jan 1, 2010
100.528
-5.767
-5.43%
jan 1, 2011
100.0
-0.528
-0.53%
jan 1, 2012
103.655
+3.655
3.66%
jan 1, 2013
105.686
+2.031
1.96%
jan 1, 2014
107.568
+1.882
1.78%
Ranking of countries by current statistics by years