Download This statistics in other country:
Timeline:
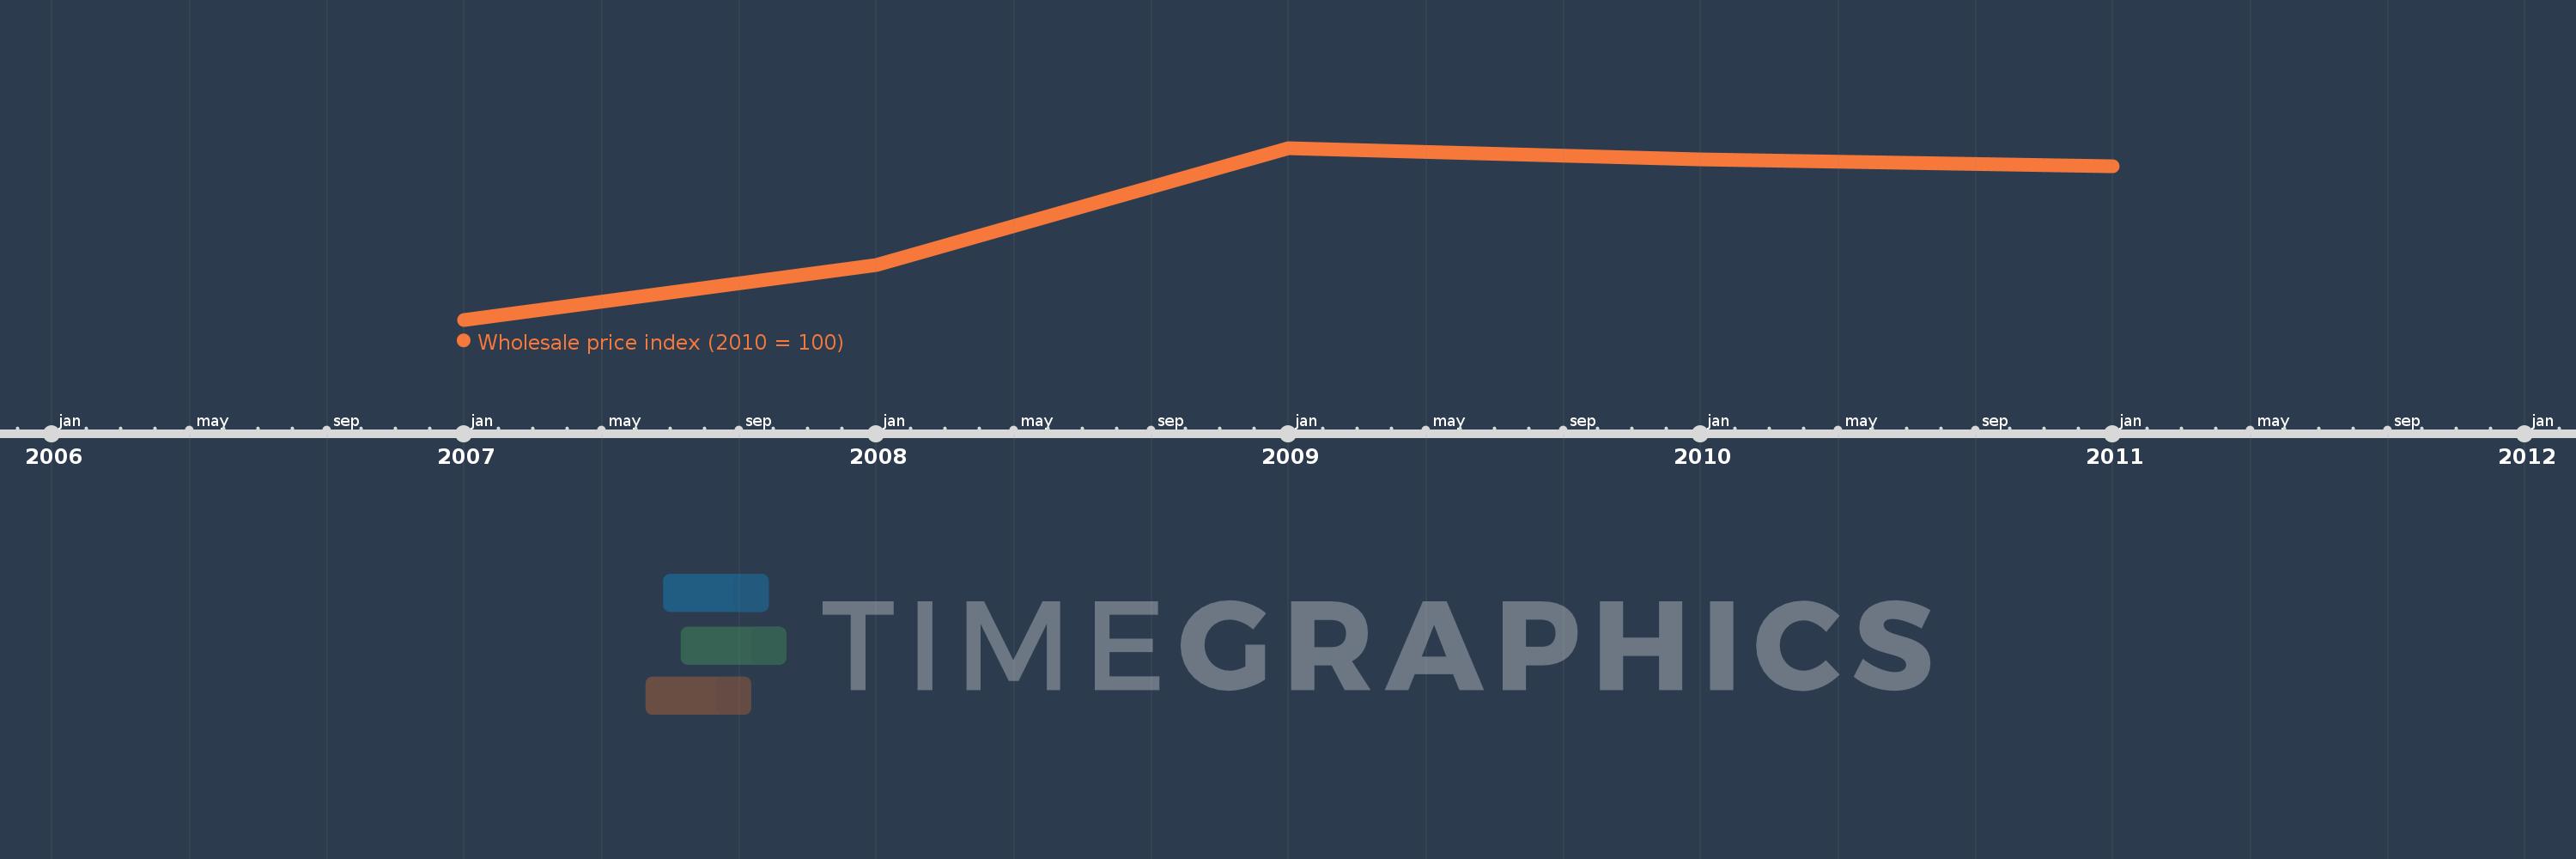
This timeline shows a graph from 2007 to 2011 of Ethiopia. No data until 2006. Number of actual observations by date: 5.
Source name:
World Development Indicators
Source organization:
International Monetary Fund, International Financial Statistics and data files.
Categories, topics:
Financial Sector
Last updated:
apr 23, 2017
Indicators value changes by year
Maximum:
105.36
jan 1, 2009
At the date of observation
Value
Absolute change
Change from the previous value
jan 1, 2007
56.13
+56.13
0.0%
jan 1, 2008
71.734
+15.604
27.8%
jan 1, 2009
105.36
+33.626
46.88%
jan 1, 2010
101.988
-3.372
-3.2%
jan 1, 2011
100.0
-1.988
-1.95%
Ranking of countries by current statistics by years