33
/
AIzaSyB4mHJ5NPEv-XzF7P6NDYXjlkCWaeKw5bc
November 30, 2025
173703
Kyrgyz Republic
KGZ
true
2
1
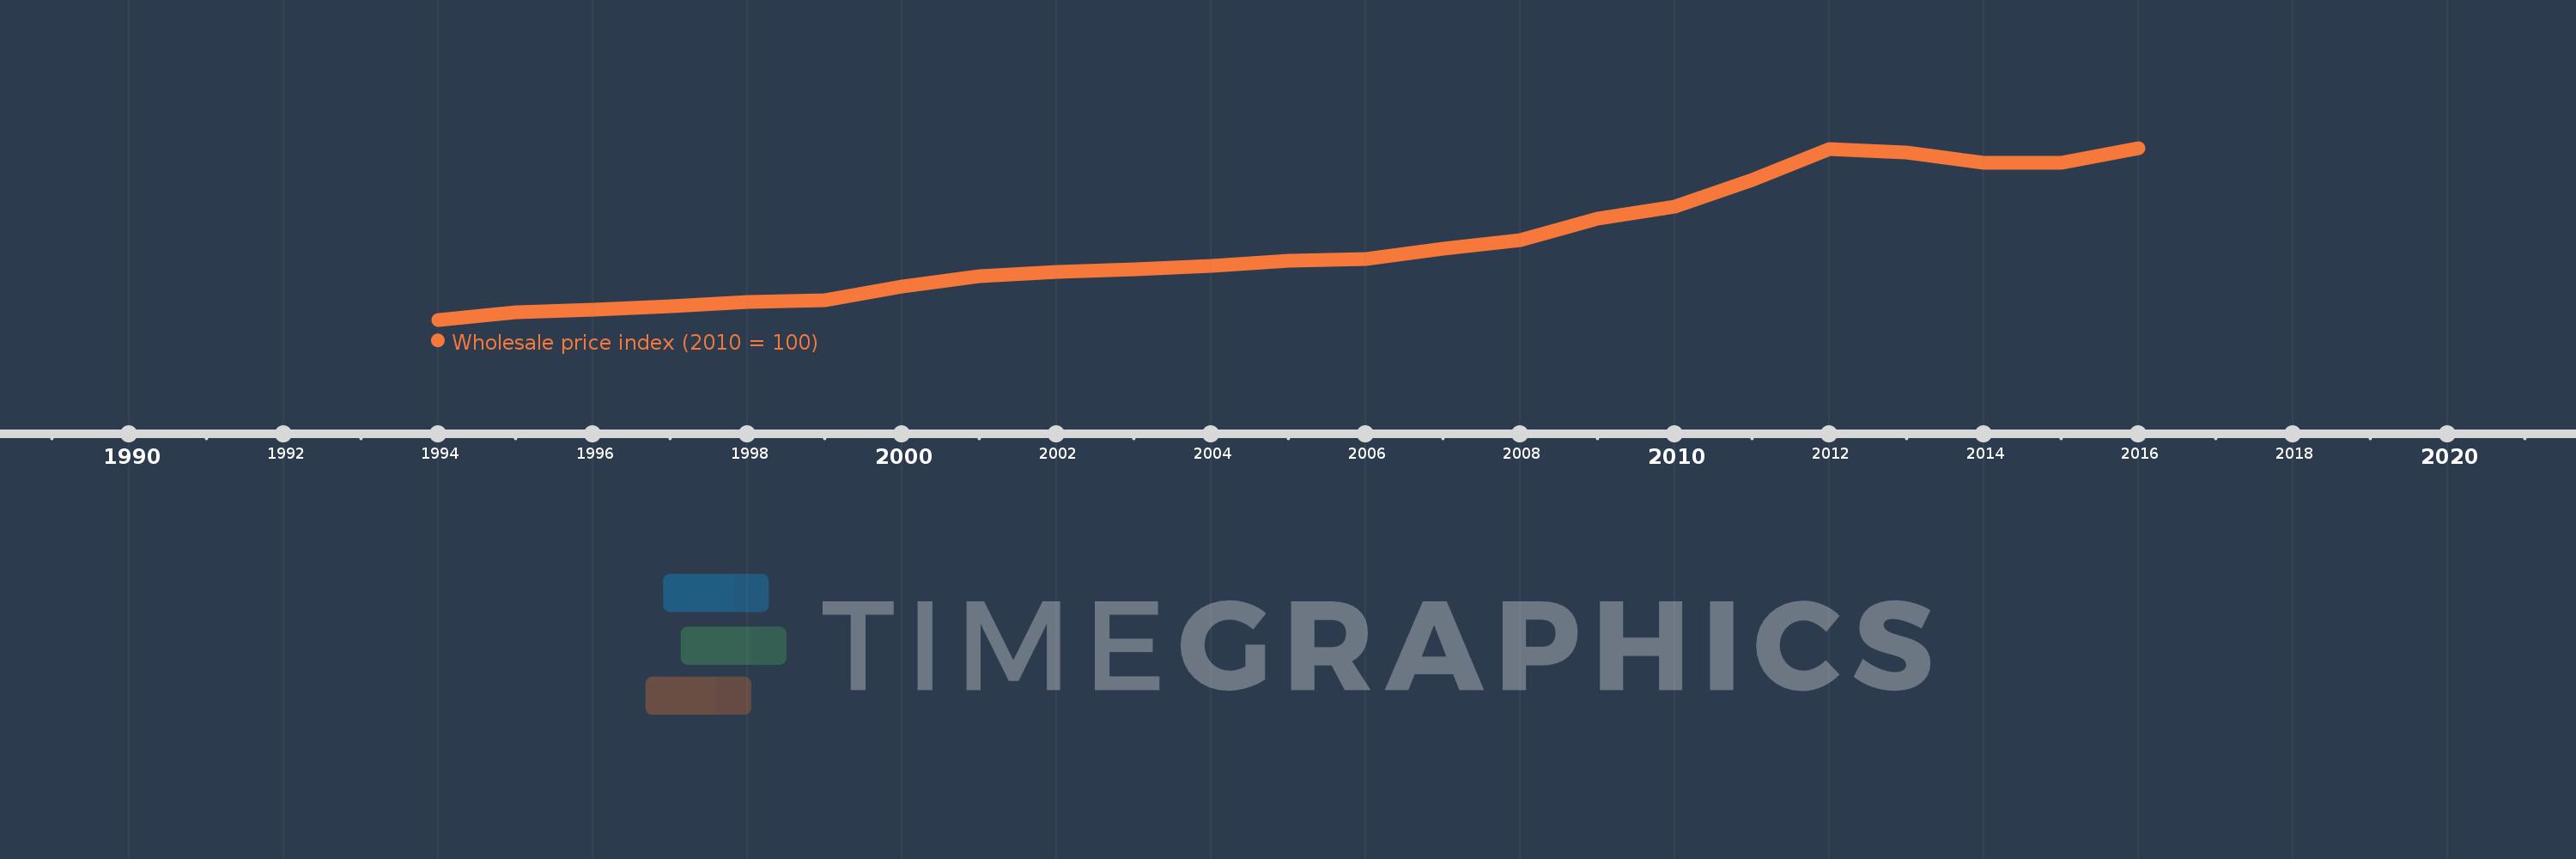
Wholesale price index (2010 = 100)
2016,2015,2014,2013,2012,2011,2010,2009,2008,2007,2006,2005,2004,2003,2002,2001,2000,1999,1998,1997,1996,1995,1994
Create a timeline
Public Timelines
For education
For educational institutions
For teachers
For students
Cabinet
For educational institutions
For teachers
For students
Open cabinet
FAQ
Close
Create a timeline
Public timelines
FAQ
About & Feedback
Terms
Privacy
FAQ
Support 24/7
Cabinet
Get premium
Donate
Download
Global statistics library
→
Kyrgyz Republic
→
Wholesale price index (2010 = 100)
This statistics in other country:
Albania
Algeria
Argentina
Armenia
Australia
Austria
Belgium
Brazil
Bulgaria
Canada
Central African Republic
Chile
China
Colombia
Congo, Rep.
Costa Rica
Croatia
Cyprus
Czech Republic
Denmark
Ecuador
Egypt, Arab Rep.
El Salvador
Estonia
Ethiopia
Euro area
Finland
France
Georgia
Germany
Greece
Hong Kong SAR, China
Hungary
India
Indonesia
Iran, Islamic Rep.
Iraq
Ireland
Israel
Italy
Japan
Jordan
Kazakhstan
Korea, Rep.
Kuwait
Kyrgyz Republic
Latvia
Lithuania
Macedonia, FYR
Malaysia
Mexico
Montenegro
Morocco
Netherlands
New Zealand
Norway
Pakistan
Panama
Paraguay
Peru
Philippines
Poland
Portugal
Romania
Saudi Arabia
Senegal
Singapore
Slovak Republic
Slovenia
South Africa
Spain
Sri Lanka
Sweden
Switzerland
Syrian Arab Republic
Thailand
Trinidad and Tobago
Tunisia
Turkey
Ukraine
United Kingdom
United States
Uruguay
Venezuela, RB
World
Zambia
Timeline:
This timeline shows a graph from
1994
to
2016
of Kyrgyz Republic. No data until
1993
. Number of actual observations by date:
23
.
Source name:
World Development Indicators
Source organization:
International Monetary Fund, International Financial Statistics and data files.
Categories, topics:
Financial Sector
Last updated:
apr 23, 2017
Indicators value changes by year
Meaning:
55.505
Minimum:
2.528
jan 1, 1994
Maximum:
122.428
jan 1, 2016
At the date of observation
Value
Absolute change
Change from the previous value
jan 1, 1994
2.528
+2.528
0.0%
jan 1, 1995
7.969
+5.441
215.26%
jan 1, 1996
9.708
+1.739
21.82%
jan 1, 1997
11.94
+2.232
22.99%
jan 1, 1998
15.076
+3.136
26.26%
jan 1, 1999
16.274
+1.198
7.95%
jan 1, 2000
25.431
+9.157
56.27%
jan 1, 2001
33.001
+7.571
29.77%
jan 1, 2002
36.01
+3.009
9.12%
jan 1, 2003
37.932
+1.922
5.34%
jan 1, 2004
40.065
+2.133
5.62%
jan 1, 2005
43.588
+3.523
8.79%
jan 1, 2006
44.949
+1.362
3.12%
jan 1, 2007
52.099
+7.15
15.91%
jan 1, 2008
58.233
+6.134
11.77%
jan 1, 2009
72.993
+14.759
25.35%
jan 1, 2010
81.259
+8.267
11.33%
jan 1, 2011
100.0
+18.741
23.06%
jan 1, 2012
121.803
+21.803
21.8%
jan 1, 2013
119.19
-2.614
-2.15%
jan 1, 2014
111.943
-7.247
-6.08%
jan 1, 2015
112.205
+0.262
0.23%
jan 1, 2016
122.428
+10.222
9.11%
Ranking of countries by current statistics by years
About & Feedback
Terms
Privacy
FAQ
Support 24/7
Cabinet
Get premium
Donate
The service accepts bank transfer (ACH, Wire) or cards (Visa, MasterCard, etc). Processed by Stripe.
Secured with SSL