33
/
AIzaSyB4mHJ5NPEv-XzF7P6NDYXjlkCWaeKw5bc
November 30, 2025
138927
Georgia
GEO
true
2
1
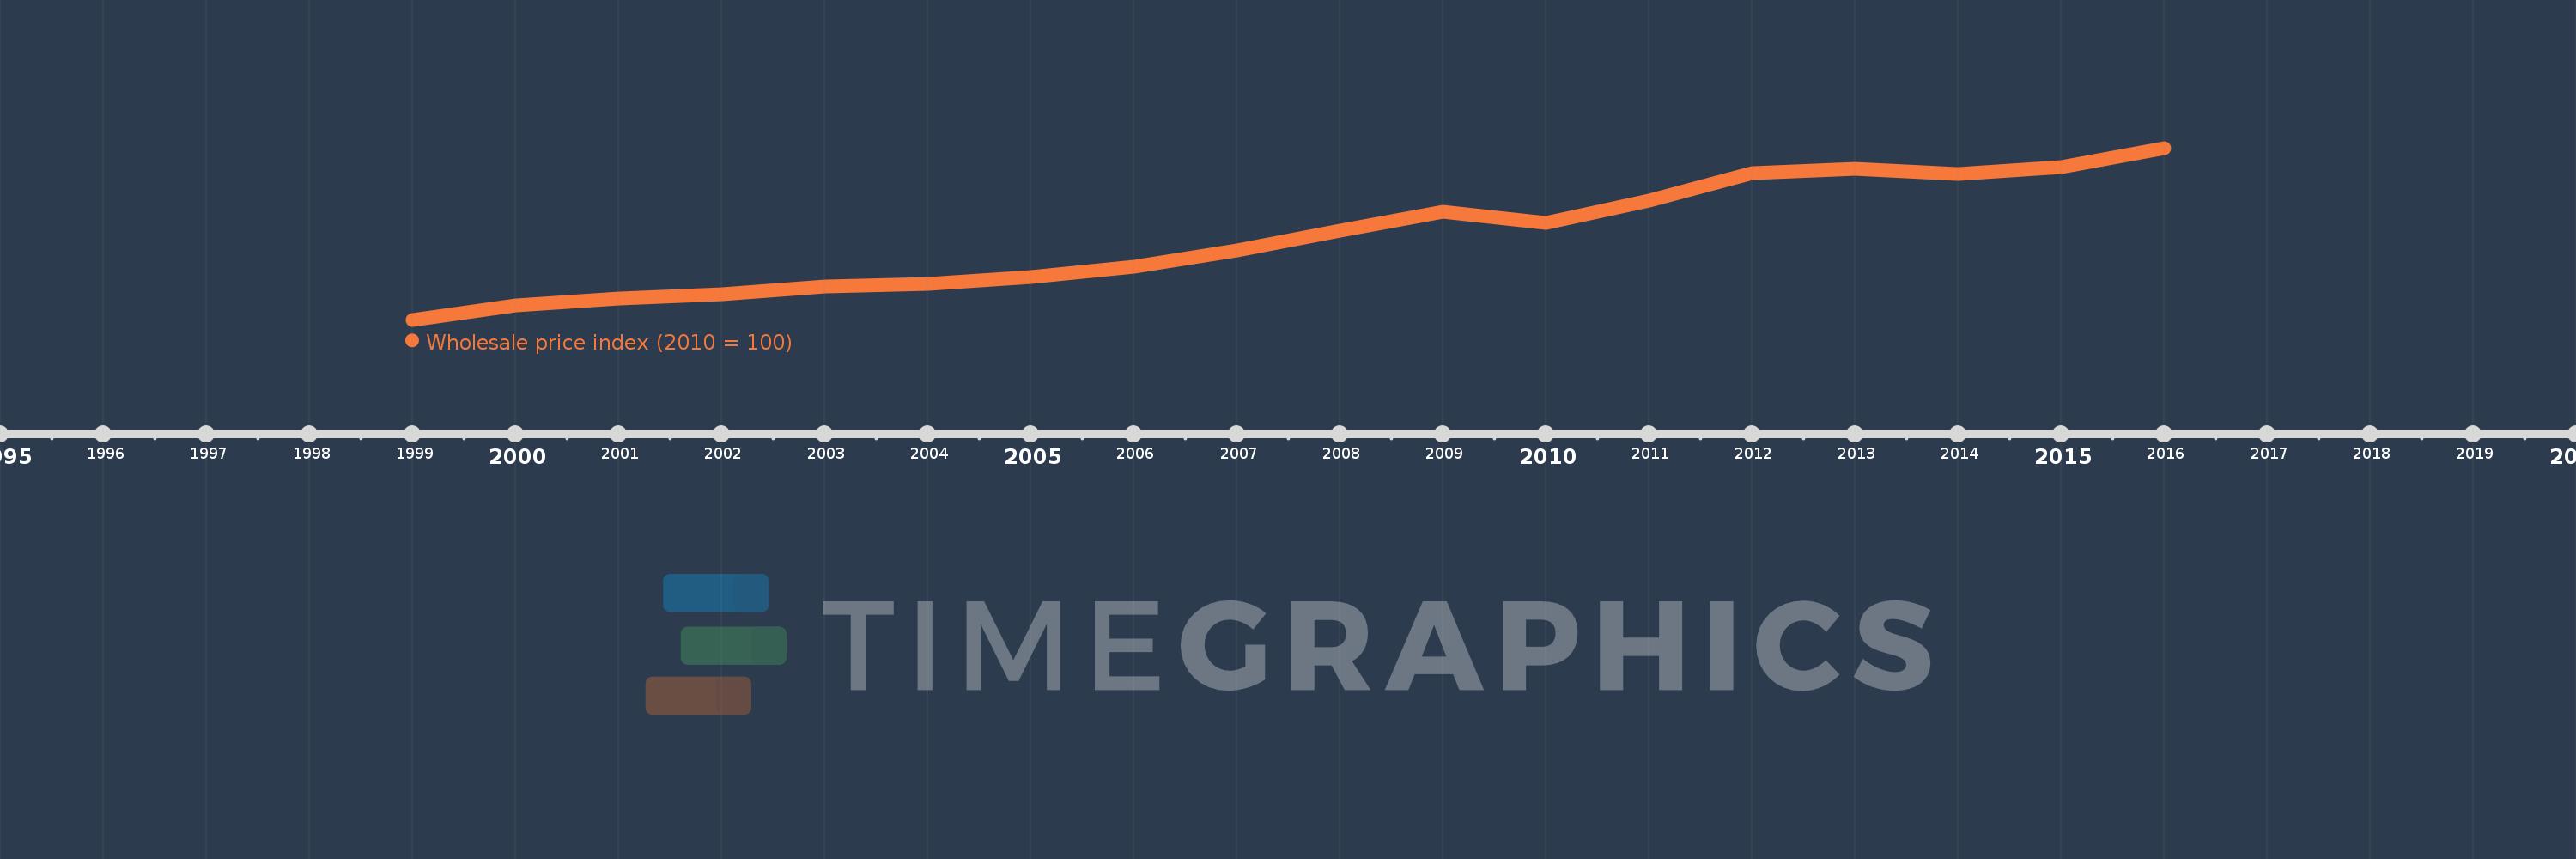
Wholesale price index (2010 = 100)
2016,2015,2014,2013,2012,2011,2010,2009,2008,2007,2006,2005,2004,2003,2002,2001,2000,1999
Create a timeline
Public Timelines
For education
For educational institutions
For teachers
For students
Cabinet
For educational institutions
For teachers
For students
Open cabinet
FAQ
Close
Create a timeline
Public timelines
FAQ
About & Feedback
Terms
Privacy
FAQ
Support 24/7
Cabinet
Get premium
Donate
Download
Global statistics library
→
Georgia
→
Wholesale price index (2010 = 100)
This statistics in other country:
Albania
Algeria
Argentina
Armenia
Australia
Austria
Belgium
Brazil
Bulgaria
Canada
Central African Republic
Chile
China
Colombia
Congo, Rep.
Costa Rica
Croatia
Cyprus
Czech Republic
Denmark
Ecuador
Egypt, Arab Rep.
El Salvador
Estonia
Ethiopia
Euro area
Finland
France
Georgia
Germany
Greece
Hong Kong SAR, China
Hungary
India
Indonesia
Iran, Islamic Rep.
Iraq
Ireland
Israel
Italy
Japan
Jordan
Kazakhstan
Korea, Rep.
Kuwait
Kyrgyz Republic
Latvia
Lithuania
Macedonia, FYR
Malaysia
Mexico
Montenegro
Morocco
Netherlands
New Zealand
Norway
Pakistan
Panama
Paraguay
Peru
Philippines
Poland
Portugal
Romania
Saudi Arabia
Senegal
Singapore
Slovak Republic
Slovenia
South Africa
Spain
Sri Lanka
Sweden
Switzerland
Syrian Arab Republic
Thailand
Trinidad and Tobago
Tunisia
Turkey
Ukraine
United Kingdom
United States
Uruguay
Venezuela, RB
World
Zambia
Timeline:
This timeline shows a graph from
1999
to
2016
of Georgia. No data until
1998
. Number of actual observations by date:
18
.
Source name:
World Development Indicators
Source organization:
International Monetary Fund, International Financial Statistics and data files.
Categories, topics:
Financial Sector
Last updated:
apr 23, 2017
Indicators value changes by year
Meaning:
83.194
Minimum:
45.736
jan 1, 1999
Maximum:
124.241
jan 1, 2016
At the date of observation
Value
Absolute change
Change from the previous value
jan 1, 1999
45.736
+45.736
0.0%
jan 1, 2000
52.267
+6.532
14.28%
jan 1, 2001
55.282
+3.015
5.77%
jan 1, 2002
57.294
+2.011
3.64%
jan 1, 2003
60.917
+3.623
6.32%
jan 1, 2004
62.254
+1.338
2.2%
jan 1, 2005
65.145
+2.891
4.64%
jan 1, 2006
69.999
+4.854
7.45%
jan 1, 2007
77.573
+7.575
10.82%
jan 1, 2008
86.565
+8.992
11.59%
jan 1, 2009
95.017
+8.451
9.76%
jan 1, 2010
89.812
-5.205
-5.48%
jan 1, 2011
100.0
+10.188
11.34%
jan 1, 2012
112.817
+12.817
12.82%
jan 1, 2013
114.647
+1.831
1.62%
jan 1, 2014
112.358
-2.289
-2.0%
jan 1, 2015
115.575
+3.217
2.86%
jan 1, 2016
124.241
+8.667
7.5%
Ranking of countries by current statistics by years
About & Feedback
Terms
Privacy
FAQ
Support 24/7
Cabinet
Get premium
Donate
The service accepts bank transfer (ACH, Wire) or cards (Visa, MasterCard, etc). Processed by Stripe.
Secured with SSL