33
/
AIzaSyB4mHJ5NPEv-XzF7P6NDYXjlkCWaeKw5bc
November 30, 2025
194587
Mauritius
MUS
true
2
1
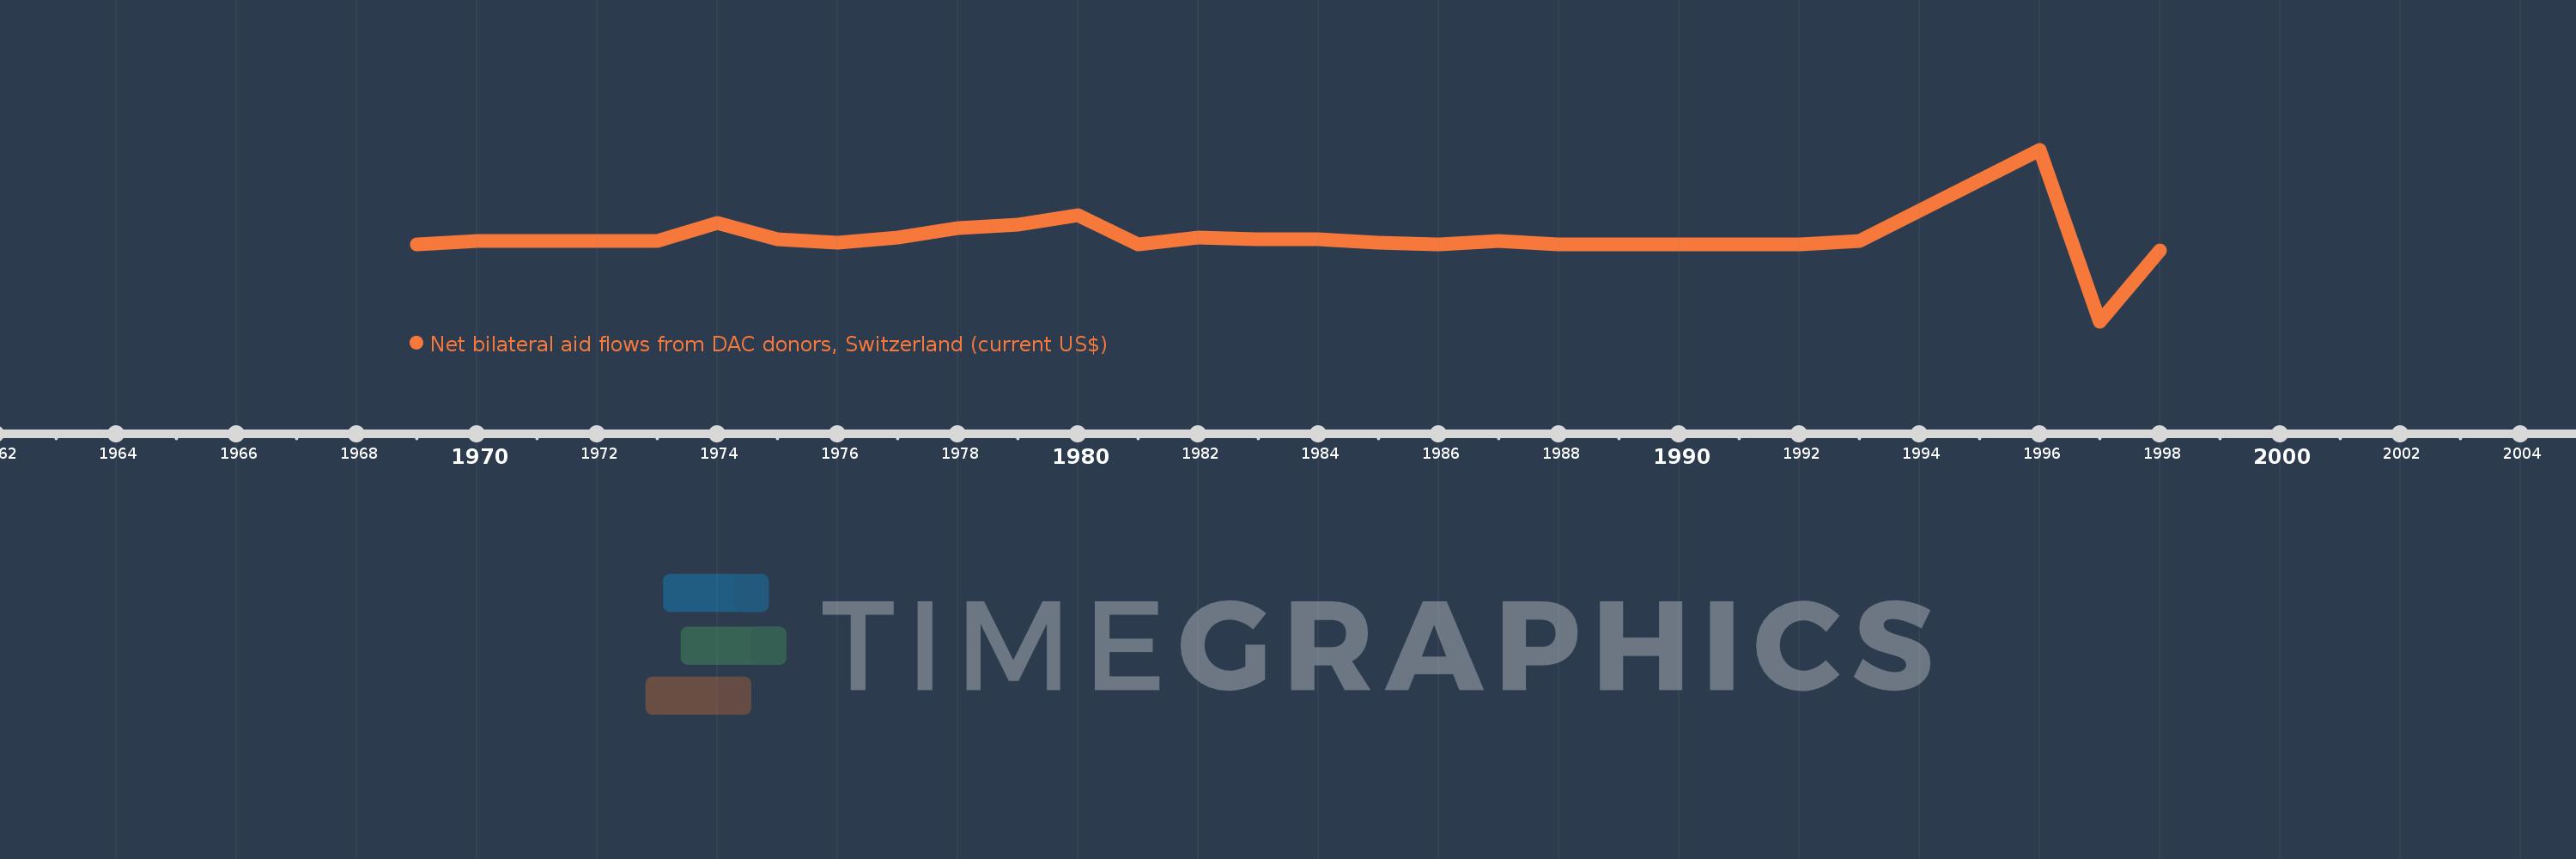
Net bilateral aid flows from DAC donors, Switzerland (current US$)
1998,1997,1996,1993,1992,1989,1988,1987,1986,1985,1984,1983,1982,1981,1980,1979,1978,1977,1976,1975,1974,1973,1972,1971,1970,1969