29
/
en
AIzaSyAYiBZKx7MnpbEhh9jyipgxe19OcubqV5w
April 1, 2024
173199
Kyrgyz Republic
KGZ
true
2
1
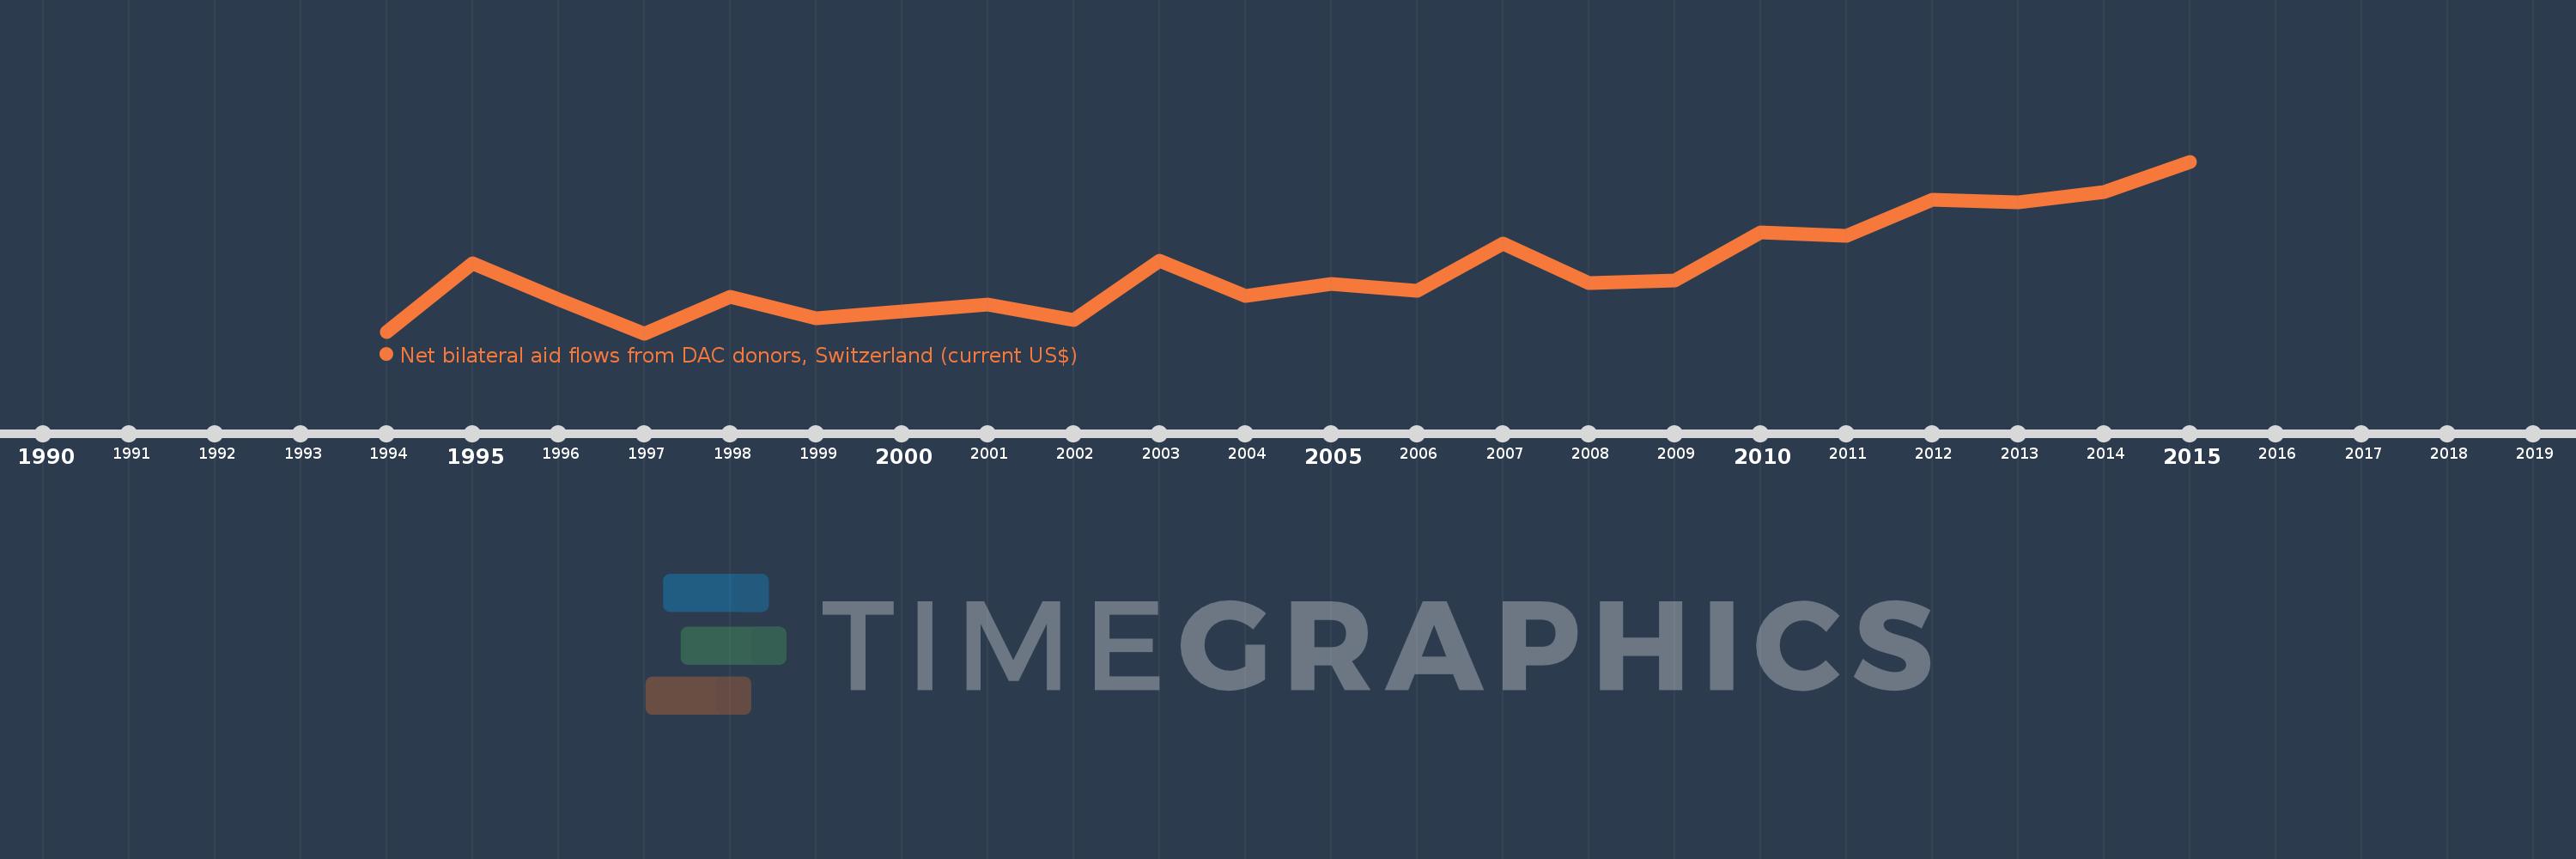
Net bilateral aid flows from DAC donors, Switzerland (current US$)
2015,2014,2013,2012,2011,2010,2009,2008,2007,2006,2005,2004,2003,2002,2001,2000,1999,1998,1997,1996,1995,1994
This statistics in other country:
AfghanistanAlbaniaAlgeriaAngolaArab WorldArgentinaArmeniaArubaAzerbaijanBahamas, TheBahrainBangladeshBarbadosBelarusBelizeBeninBhutanBoliviaBosnia and HerzegovinaBotswanaBrazilBulgariaBurkina FasoBurundiCabo VerdeCambodiaCameroonCaribbean small statesCentral African RepublicCentral Europe and the BalticsChadChileChinaColombiaComorosCongo, Dem. Rep.Congo, Rep.Costa RicaCote d'IvoireCroatiaCubaCyprusCzech RepublicDjiboutiDominicaDominican RepublicEast Asia & PacificEast Asia & Pacific (excluding high income)East Asia & Pacific (IDA & IBRD countries)EcuadorEgypt, Arab Rep.El SalvadorEquatorial GuineaEritreaEstoniaEthiopiaEuro areaEurope & Central AsiaEurope & Central Asia (excluding high income)Europe & Central Asia (IDA & IBRD countries)European UnionFijiFragile and conflict affected situationsFrench PolynesiaGabonGambia, TheGeorgiaGhanaGrenadaGuatemalaGuineaGuinea-BissauGuyanaHaitiHeavily indebted poor countries (HIPC)High incomeHondurasHong Kong SAR, ChinaHungaryIBRD onlyIDA & IBRD totalIDA blendIDA onlyIDA totalIndiaIndonesiaIran, Islamic Rep.IraqIsraelJamaicaJordanKazakhstanKenyaKorea, Dem. People’s Rep.Korea, Rep.KosovoKyrgyz RepublicLao PDRLatin America & Caribbean Latin America & Caribbean (excluding high income)Latin America & the Caribbean (IDA & IBRD countries)LatviaLeast developed countries: UN classificationLebanonLesothoLiberiaLibyaLithuaniaLow & middle incomeLow incomeLower middle incomeMacao SAR, ChinaMacedonia, FYRMadagascarMalawiMalaysiaMaldivesMaliMaltaMarshall IslandsMauritaniaMauritiusMexicoMicronesia, Fed. Sts.Middle East & North AfricaMiddle East & North Africa (excluding high income)Middle East & North Africa (IDA & IBRD countries)Middle incomeMoldovaMongoliaMontenegroMoroccoMozambiqueMyanmarNamibiaNauruNepalNew CaledoniaNicaraguaNigerNigeriaOECD membersOmanOther small statesPacific island small statesPakistanPanamaPapua New GuineaParaguayPeruPhilippinesPolandRomaniaRussian FederationRwandaSamoaSao Tome and PrincipeSaudi ArabiaSenegalSerbiaSeychellesSierra LeoneSingaporeSlovak RepublicSloveniaSmall statesSolomon IslandsSomaliaSouth AfricaSouth AsiaSouth Asia (IDA & IBRD)South SudanSri LankaSt. Kitts and NevisSt. Vincent and the GrenadinesSub-Saharan Africa Sub-Saharan Africa (excluding high income)Sub-Saharan Africa (IDA & IBRD countries)SudanSurinameSwazilandSyrian Arab RepublicTajikistanTanzaniaThailandTimor-LesteTogoTongaTrinidad and TobagoTunisiaTurkeyTurkmenistanTuvaluUgandaUkraineUpper middle incomeUruguayUzbekistanVanuatuVenezuela, RBVietnamWest Bank and GazaWorldYemen, Rep.ZambiaZimbabwe Timeline:
This timeline shows a graph from 1994 to 2015 of Kyrgyz Republic. No data until 1993. Number of actual observations by date: 22.
Source name:
World Development Indicators
Source organization:
Development Assistance Committee of the Organisation for Economic Co-operation and Development, Geographical Distribution of Financial Flows to Developing Countries, Development Co-operation Report, and International Development Statistics database. Data are available online at: www.oecd.org/dac/stats/idsonline.
Categories, topics:
Aid Effectiveness
Last updated:
apr 23, 2017
Indicators value changes by year
Minimum:
2.89 mln
jan 1, 1997
Maximum:
28.95 mln
jan 1, 2015
At the date of observation
Value
Absolute change
Change from previous value
jan 1, 1994
3.04 mln
+3.04 mln
0.0%
jan 1, 1995
13.51 mln
+10.47 mln
344.41%
jan 1, 1996
8.06 mln
-5.45 mln
-40.34%
jan 1, 1997
2.89 mln
-5.17 mln
-64.14%
jan 1, 1998
8.47 mln
+5.58 mln
193.08%
jan 1, 1999
5.21 mln
-3.26 mln
-38.49%
jan 1, 2000
6.15 mln
+940.0K
18.04%
jan 1, 2001
7.24 mln
+1.09 mln
17.72%
jan 1, 2002
4.9 mln
-2.34 mln
-32.32%
jan 1, 2003
13.85 mln
+8.95 mln
182.65%
jan 1, 2004
8.6 mln
-5.25 mln
-37.91%
jan 1, 2005
10.42 mln
+1.82 mln
21.16%
jan 1, 2006
9.31 mln
-1.11 mln
-10.65%
jan 1, 2007
16.54 mln
+7.23 mln
77.66%
jan 1, 2008
10.56 mln
-5.98 mln
-36.15%
jan 1, 2009
10.87 mln
+310.0K
2.94%
jan 1, 2010
18.16 mln
+7.29 mln
67.07%
jan 1, 2011
17.63 mln
-530.0K
-2.92%
jan 1, 2012
23.11 mln
+5.48 mln
31.08%
jan 1, 2013
22.81 mln
-300.0K
-1.3%
jan 1, 2014
24.26 mln
+1.45 mln
6.36%
jan 1, 2015
28.95 mln
+4.69 mln
19.33%
Ranking of countries by current statistics by years
Comments: