33
/
AIzaSyB4mHJ5NPEv-XzF7P6NDYXjlkCWaeKw5bc
November 30, 2025
137062
Gambia, The
GMB
true
2
1
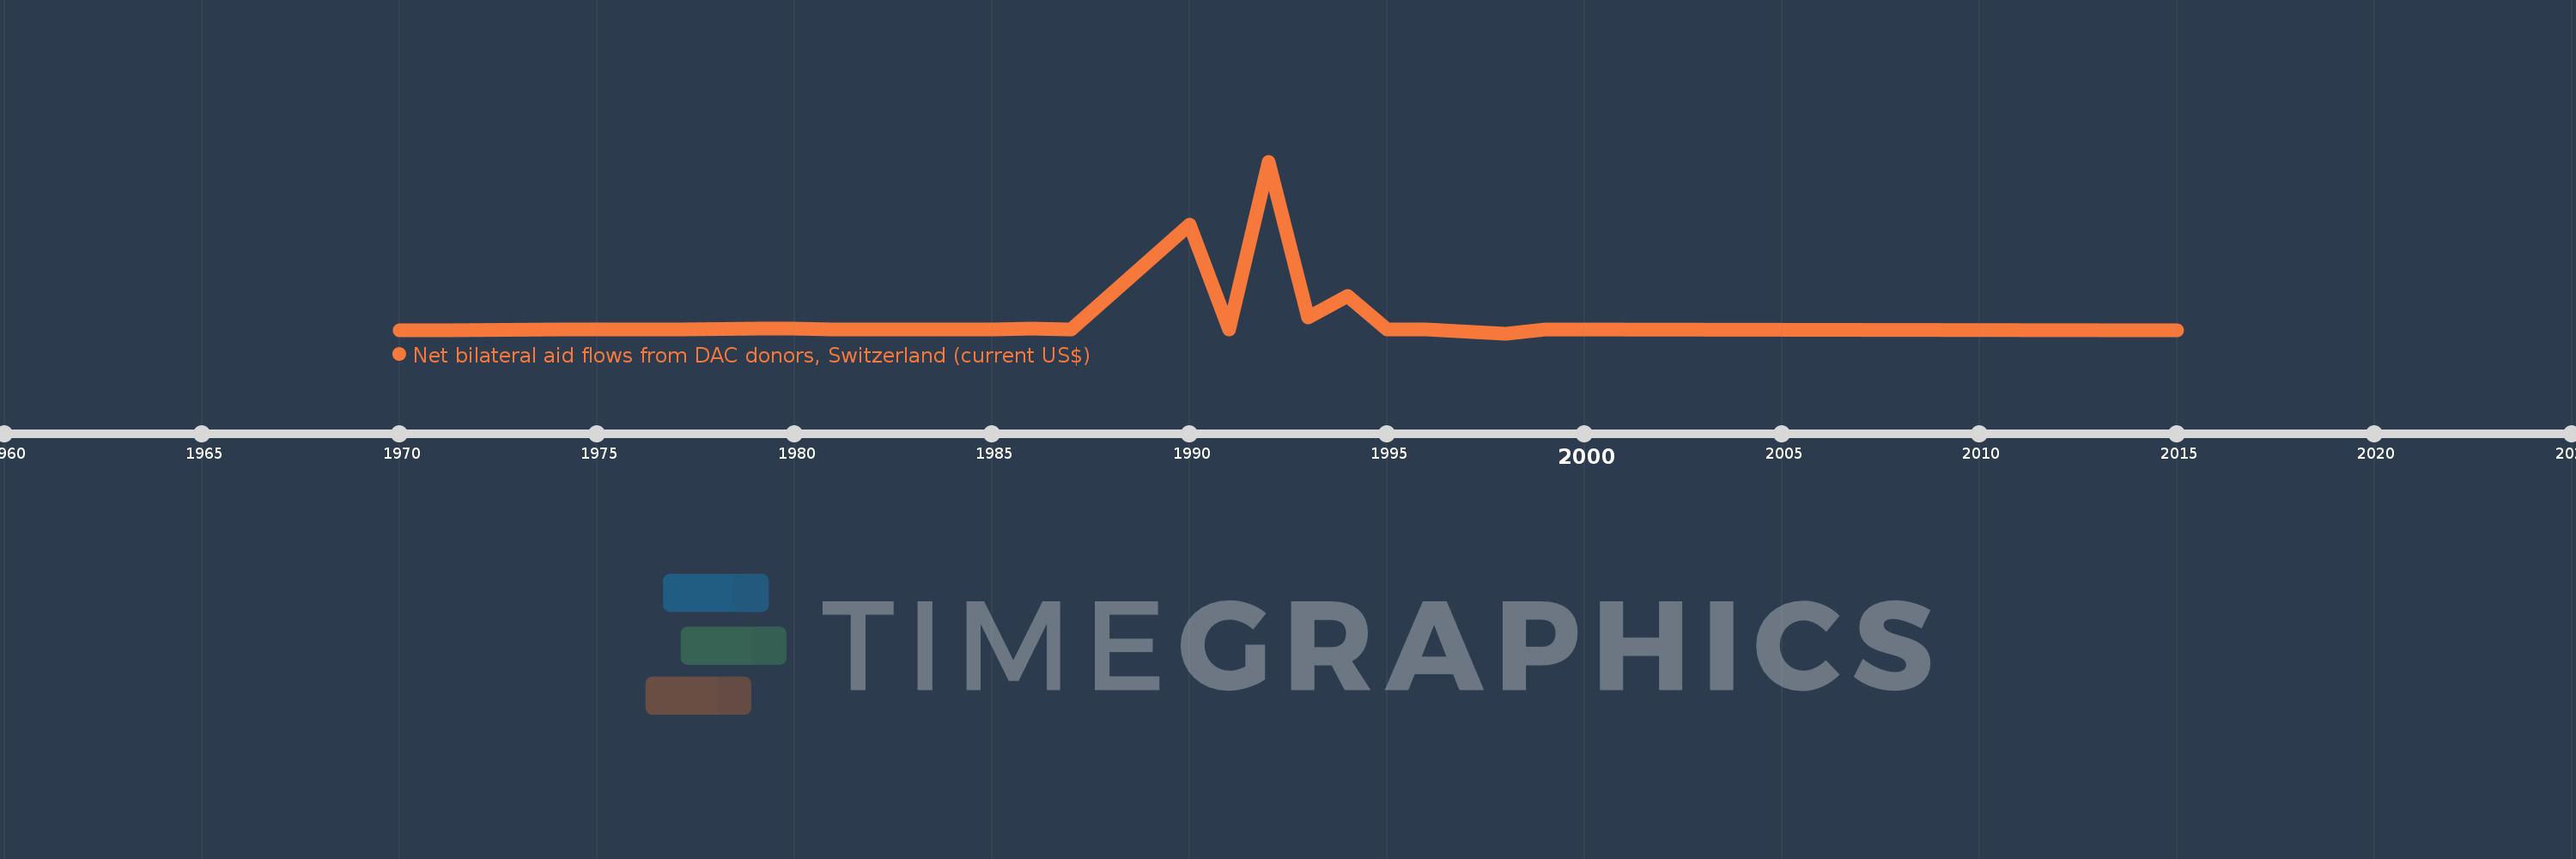
Net bilateral aid flows from DAC donors, Switzerland (current US$)
2015,1999,1998,1996,1995,1994,1993,1992,1991,1990,1987,1986,1985,1984,1983,1982,1981,1980,1979,1977,1974,1971,1970