30
/
AIzaSyAYiBZKx7MnpbEhh9jyipgxe19OcubqV5w
April 1, 2024
115133
Croatia
HRV
true
2
1
Net bilateral aid flows from DAC donors, Switzerland (current US$)
2011,2010,2009,2008,2007,2006,2005,2004,2003,2002,2001,2000,1999,1998,1997,1996
Download
Global statistics library →Croatia →

Net bilateral aid flows from DAC donors, Switzerland (current US$)

This statistics in other country:

AfghanistanAlbaniaAlgeriaAngolaArab WorldArgentinaArmeniaArubaAzerbaijanBahamas, TheBahrainBangladeshBarbadosBelarusBelizeBeninBhutanBoliviaBosnia and HerzegovinaBotswanaBrazilBulgariaBurkina FasoBurundiCabo VerdeCambodiaCameroonCaribbean small statesCentral African RepublicCentral Europe and the BalticsChadChileChinaColombiaComorosCongo, Dem. Rep.Congo, Rep.Costa RicaCote d'IvoireCroatiaCubaCyprusCzech RepublicDjiboutiDominicaDominican RepublicEast Asia & PacificEast Asia & Pacific (excluding high income)East Asia & Pacific (IDA & IBRD countries)EcuadorEgypt, Arab Rep.El SalvadorEquatorial GuineaEritreaEstoniaEthiopiaEuro areaEurope & Central AsiaEurope & Central Asia (excluding high income)Europe & Central Asia (IDA & IBRD countries)European UnionFijiFragile and conflict affected situationsFrench PolynesiaGabonGambia, TheGeorgiaGhanaGrenadaGuatemalaGuineaGuinea-BissauGuyanaHaitiHeavily indebted poor countries (HIPC)High incomeHondurasHong Kong SAR, ChinaHungaryIBRD onlyIDA & IBRD totalIDA blendIDA onlyIDA totalIndiaIndonesiaIran, Islamic Rep.IraqIsraelJamaicaJordanKazakhstanKenyaKorea, Dem. People’s Rep.Korea, Rep.KosovoKyrgyz RepublicLao PDRLatin America & Caribbean Latin America & Caribbean (excluding high income)Latin America & the Caribbean (IDA & IBRD countries)LatviaLeast developed countries: UN classificationLebanonLesothoLiberiaLibyaLithuaniaLow & middle incomeLow incomeLower middle incomeMacao SAR, ChinaMacedonia, FYRMadagascarMalawiMalaysiaMaldivesMaliMaltaMarshall IslandsMauritaniaMauritiusMexicoMicronesia, Fed. Sts.Middle East & North AfricaMiddle East & North Africa (excluding high income)Middle East & North Africa (IDA & IBRD countries)Middle incomeMoldovaMongoliaMontenegroMoroccoMozambiqueMyanmarNamibiaNauruNepalNew CaledoniaNicaraguaNigerNigeriaOECD membersOmanOther small statesPacific island small statesPakistanPanamaPapua New GuineaParaguayPeruPhilippinesPolandRomaniaRussian FederationRwandaSamoaSao Tome and PrincipeSaudi ArabiaSenegalSerbiaSeychellesSierra LeoneSingaporeSlovak RepublicSloveniaSmall statesSolomon IslandsSomaliaSouth AfricaSouth AsiaSouth Asia (IDA & IBRD)South SudanSri LankaSt. Kitts and NevisSt. Vincent and the GrenadinesSub-Saharan Africa Sub-Saharan Africa (excluding high income)Sub-Saharan Africa (IDA & IBRD countries)SudanSurinameSwazilandSyrian Arab RepublicTajikistanTanzaniaThailandTimor-LesteTogoTongaTrinidad and TobagoTunisiaTurkeyTurkmenistanTuvaluUgandaUkraineUpper middle incomeUruguayUzbekistanVanuatuVenezuela, RBVietnamWest Bank and GazaWorldYemen, Rep.ZambiaZimbabwe

Timeline:

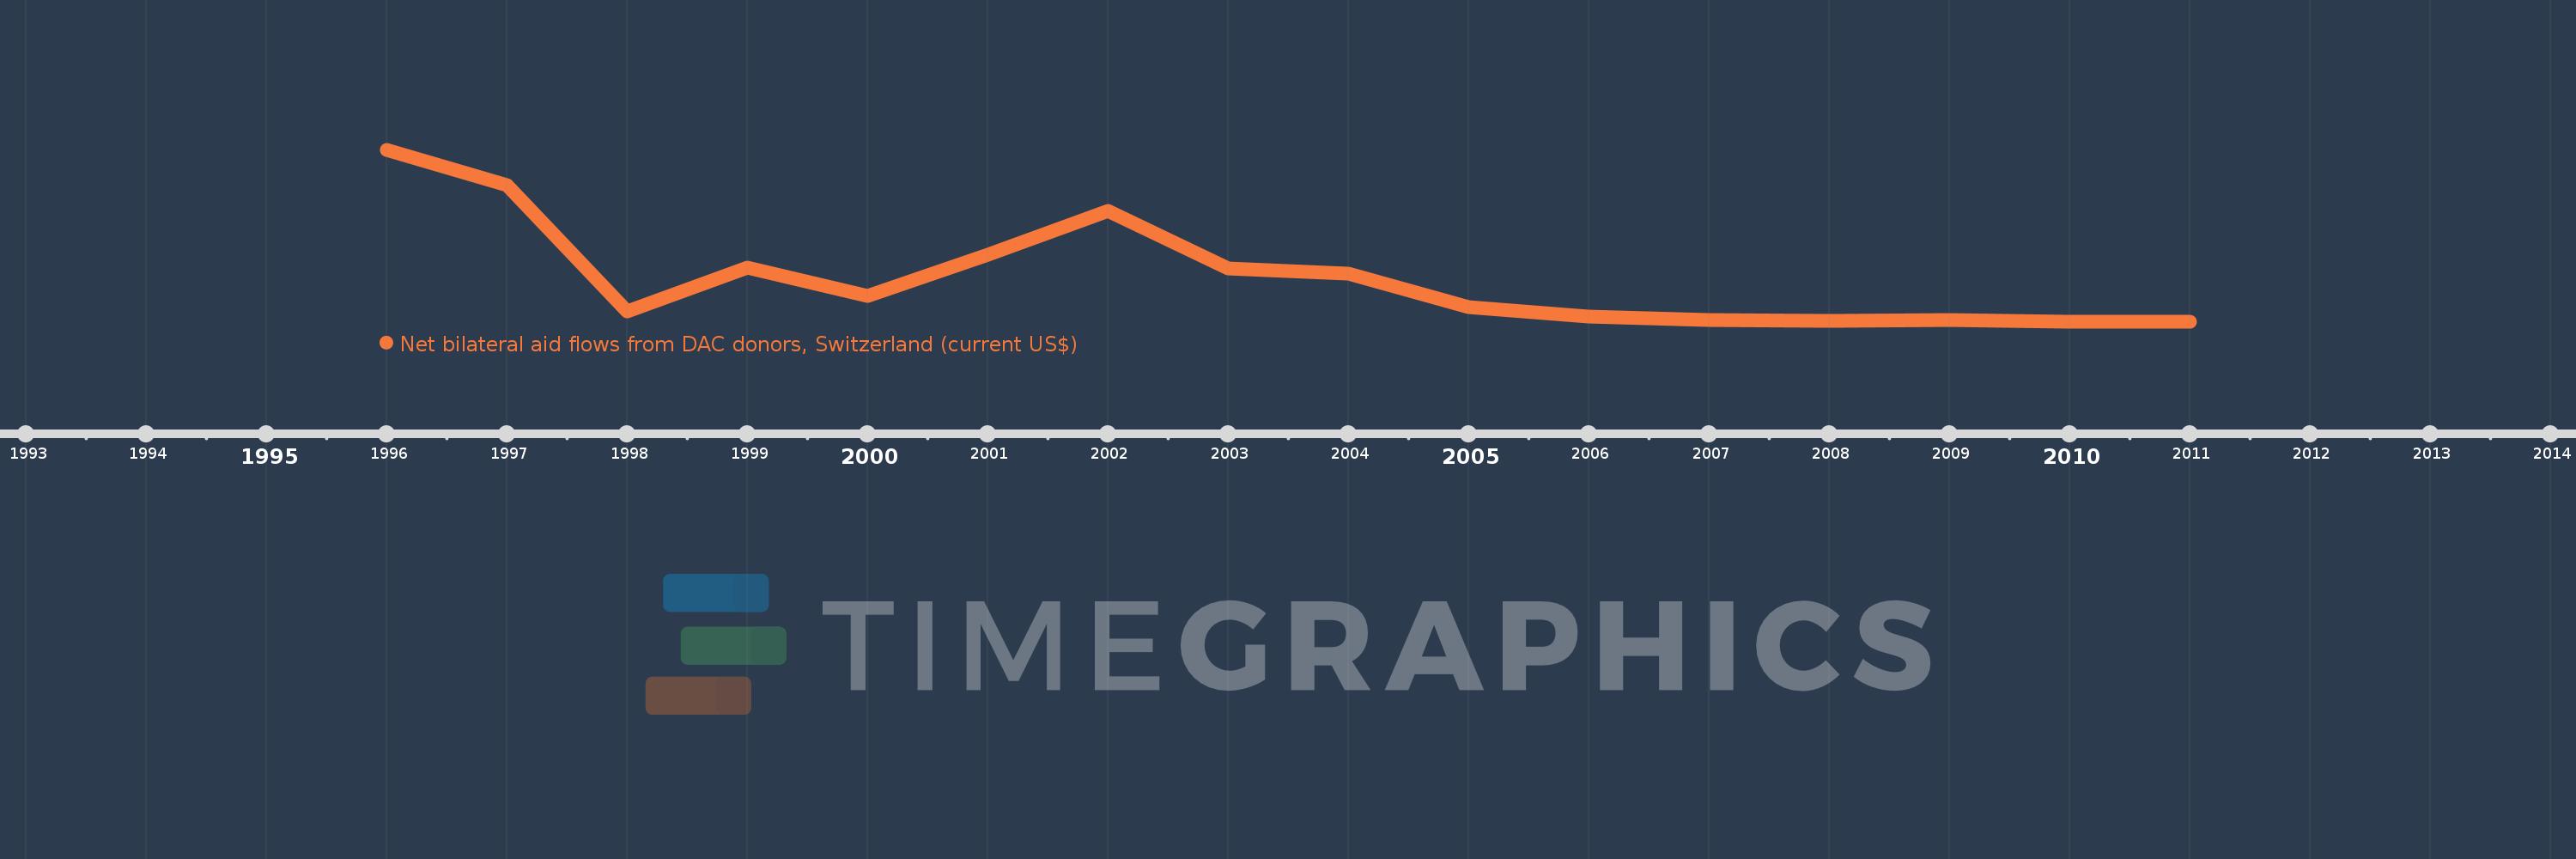
This timeline shows a graph from 1996 to 2011 of Croatia. No data until 1995. Number of actual observations by date: 16.

Source name:

World Development Indicators

Source organization:

Development Assistance Committee of the Organisation for Economic Co-operation and Development, Geographical Distribution of Financial Flows to Developing Countries, Development Co-operation Report, and International Development Statistics database. Data are available online at: www.oecd.org/dac/stats/idsonline.

Categories, topics:

Aid Effectiveness

Last updated:

apr 23, 2017

Indicators value changes by year

Meaning:
1.289 mln
Minimum:
70.0K
jan 1, 2011
Maximum:
4.82 mln
jan 1, 1996
At the date of observation
Value
Absolute change
Change from the previous value
jan 1, 1996
4.82 mln
+4.82 mln
0.0%
jan 1, 1997
3.85 mln
-970.0K
-20.12%
jan 1, 1998
370.0K
-3.48 mln
-90.39%
jan 1, 1999
1.58 mln
+1.21 mln
327.03%
jan 1, 2000
780.0K
-800.0K
-50.63%
jan 1, 2001
1.93 mln
+1.15 mln
147.44%
jan 1, 2002
3.13 mln
+1.2 mln
62.18%
jan 1, 2003
1.55 mln
-1.58 mln
-50.48%
jan 1, 2004
1.4 mln
-150.0K
-9.68%
jan 1, 2005
490.0K
-910.0K
-65.0%
jan 1, 2006
230.0K
-260.0K
-53.06%
jan 1, 2007
130.0K
-100.0K
-43.48%
jan 1, 2008
90.0K
-40.0K
-30.77%
jan 1, 2009
130.0K
+40.0K
44.44%
jan 1, 2010
80.0K
-50.0K
-38.46%
jan 1, 2011
70.0K
-10.0K
-12.5%

Ranking of countries by current statistics by years