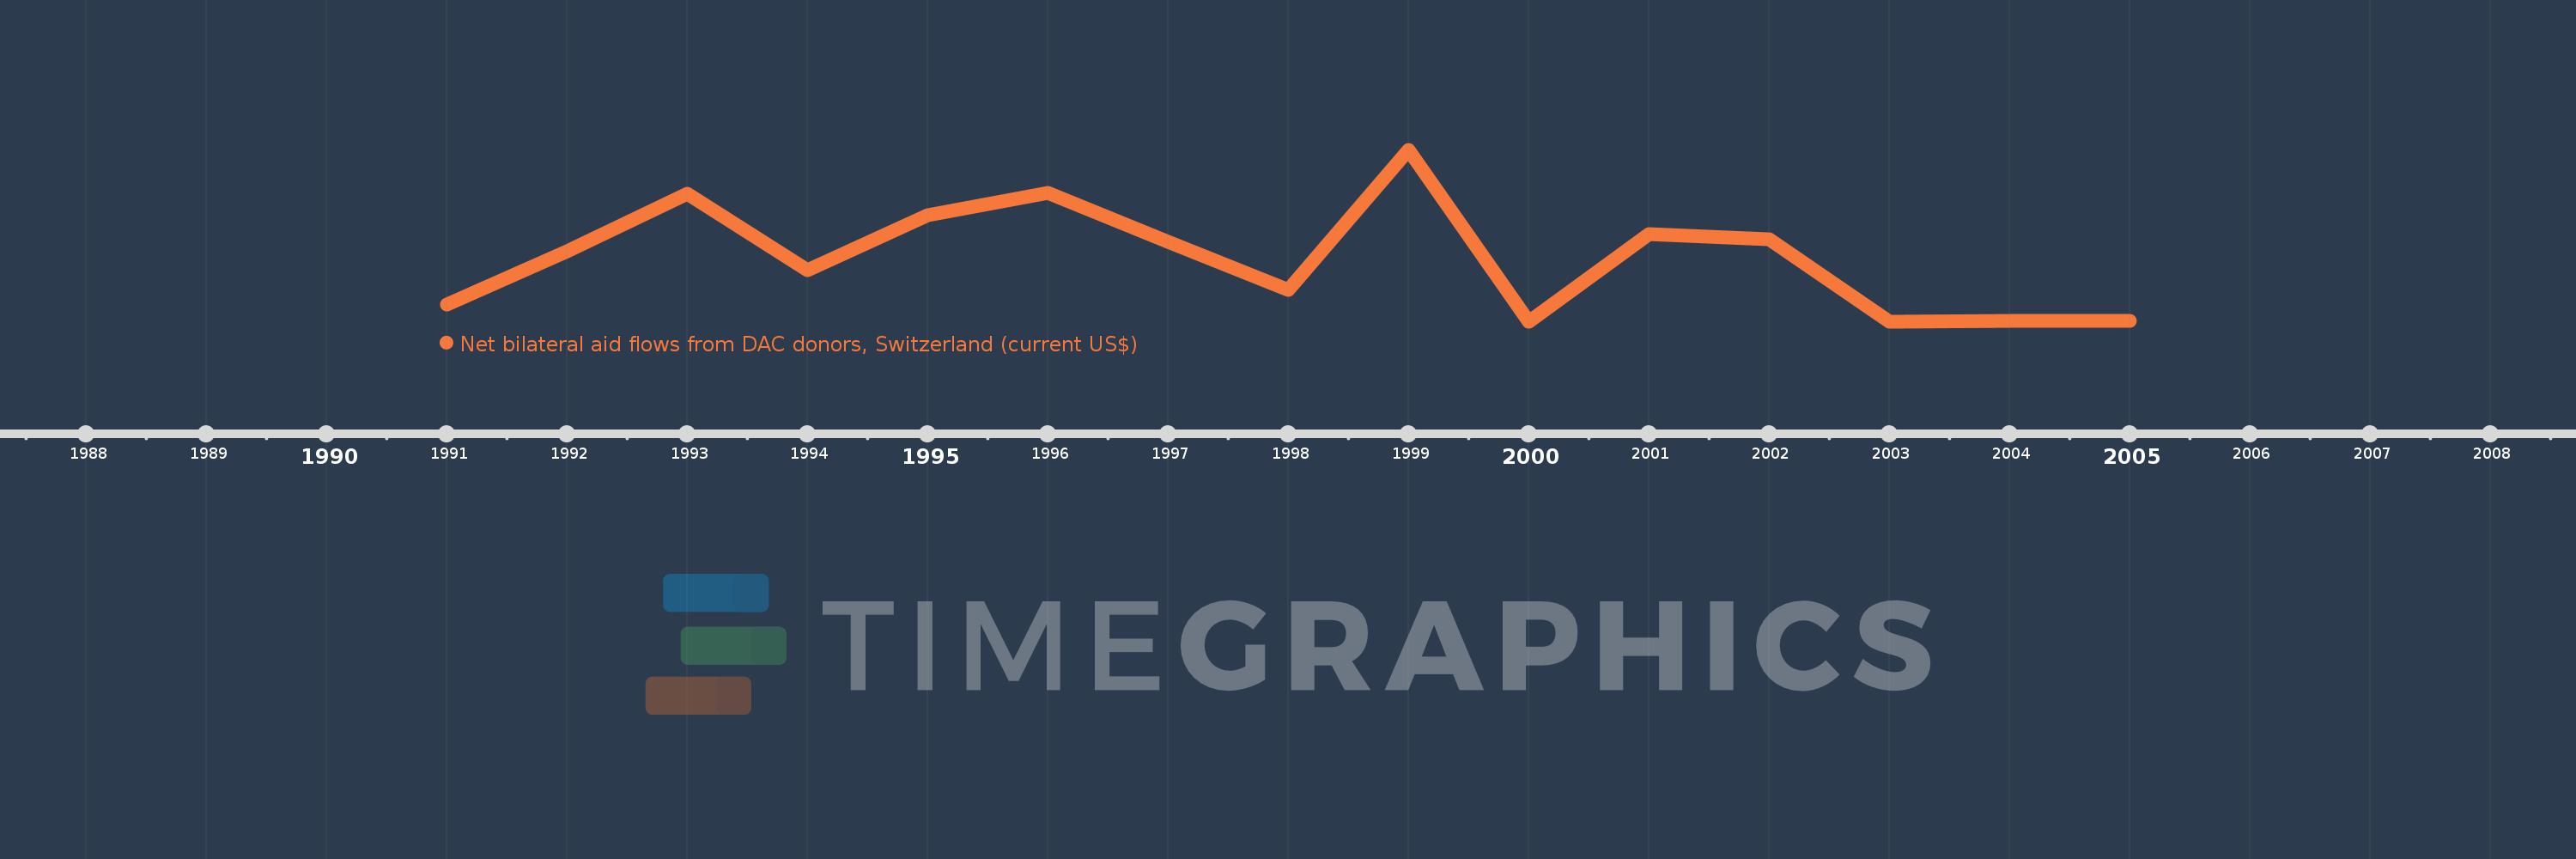
This timeline shows a graph from 1991 to 2005 of Hungary. No data until 1990. Number of actual observations by date: 15.
Source name:
World Development Indicators
Source organization:
Development Assistance Committee of the Organisation for Economic Co-operation and Development, Geographical Distribution of Financial Flows to Developing Countries, Development Co-operation Report, and International Development Statistics database. Data are available online at: www.oecd.org/dac/stats/idsonline.
Categories, topics:
Aid Effectiveness
Last updated:
apr 23, 2017
Indicators value changes by year
Meaning:
3.621 mln
Minimum:
90.0K
jan 1, 2000
Maximum:
9.55 mln
jan 1, 1999
At the date of observation
Value
Absolute change
Change from the previous value
jan 1, 1991
1.03 mln
+1.03 mln
0.0%
jan 1, 1992
4.0 mln
+2.97 mln
288.35%
jan 1, 1993
7.16 mln
+3.16 mln
79.0%
jan 1, 1994
2.96 mln
-4.2 mln
-58.66%
jan 1, 1995
5.95 mln
+2.99 mln
101.01%
jan 1, 1996
7.21 mln
+1.26 mln
21.18%
jan 1, 1997
4.49 mln
-2.72 mln
-37.73%
jan 1, 1998
1.87 mln
-2.62 mln
-58.35%
jan 1, 1999
9.55 mln
+7.68 mln
410.7%
jan 1, 2000
90.0K
-9.46 mln
-99.06%
jan 1, 2001
4.95 mln
+4.86 mln
5.4K%
jan 1, 2002
4.65 mln
-300.0K
-6.06%
jan 1, 2003
110.0K
-4.54 mln
-97.63%
jan 1, 2004
130.0K
+20.0K
18.18%
jan 1, 2005
160.0K
+30.0K
23.08%
Ranking of countries by current statistics by years