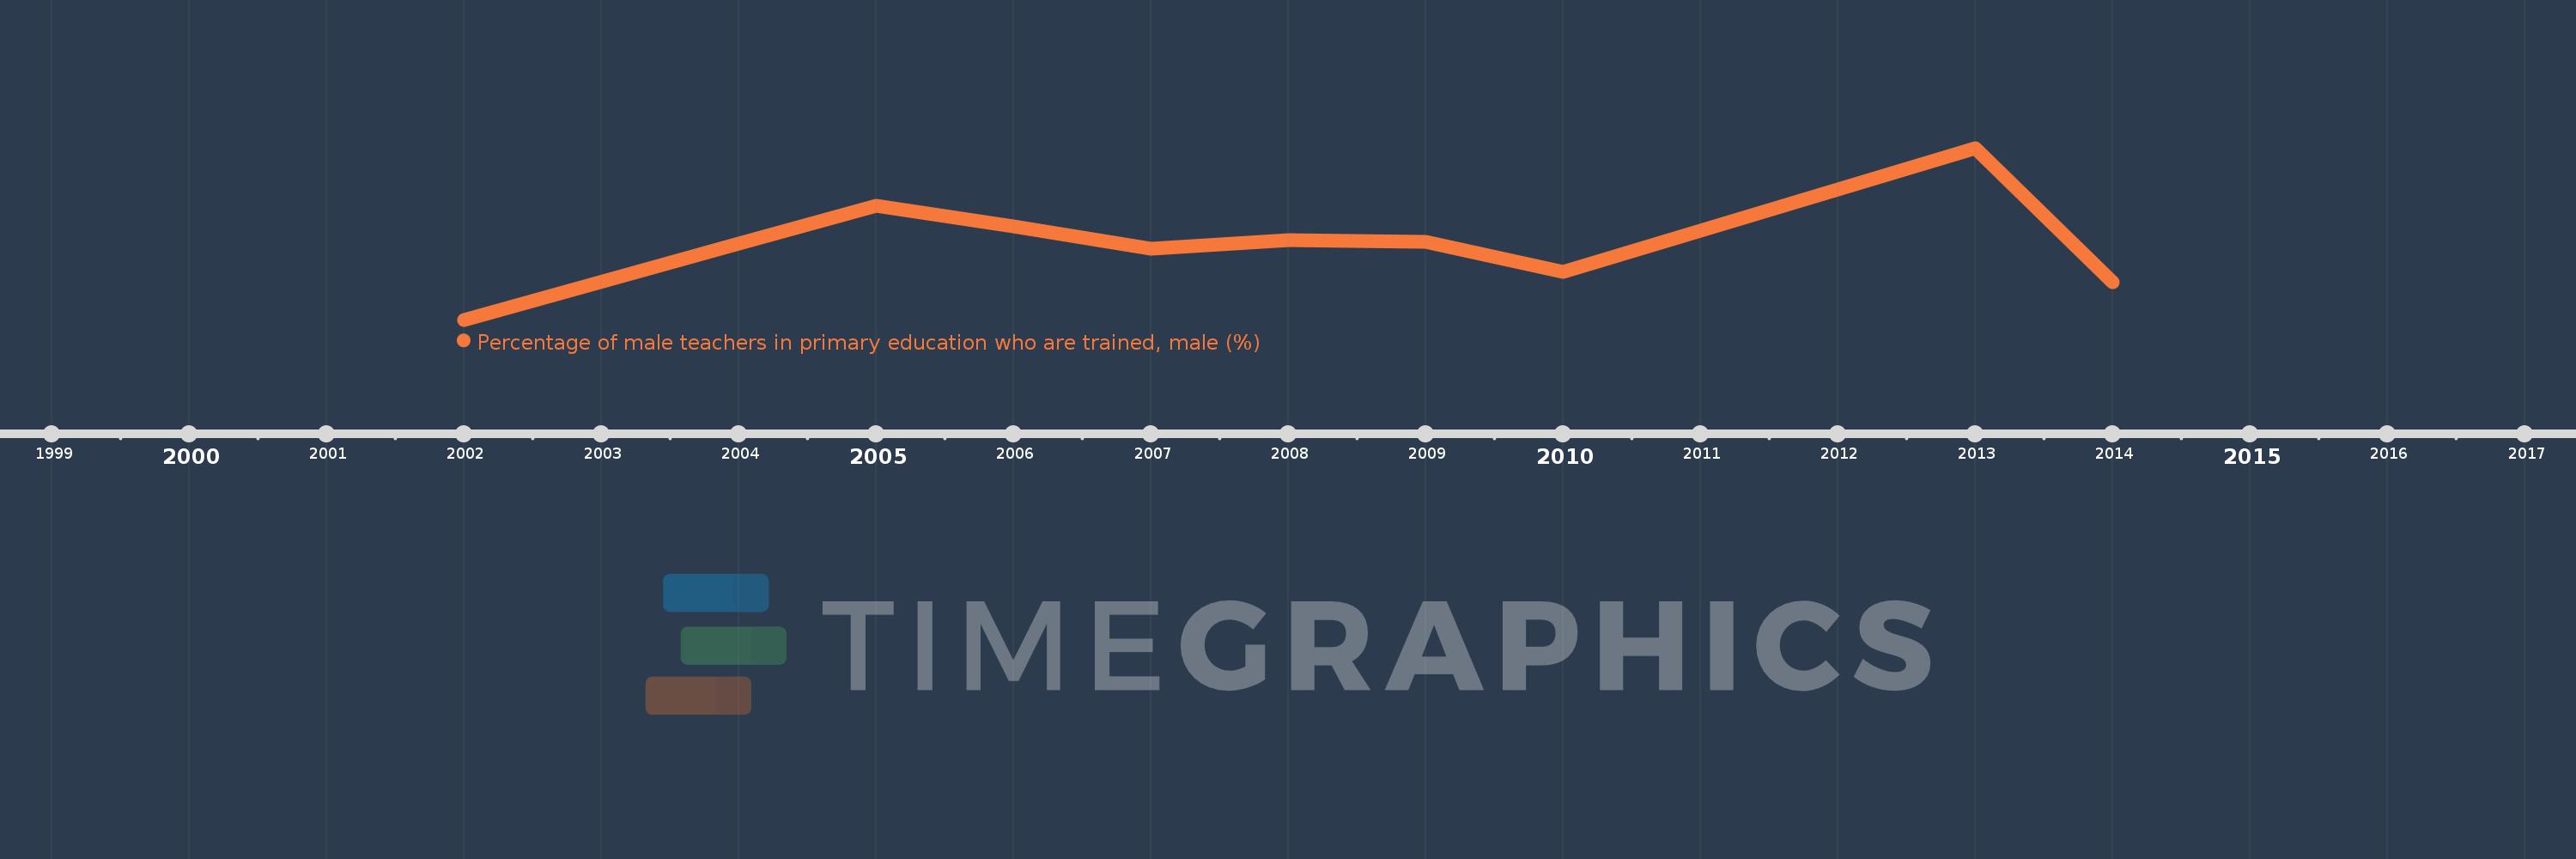
Questa scala temporale mostra un grafico dal 2002 anno al 2014 anno. Burkina Faso. I dati fino ad 2001 anno non disponibili. Il numero di osservazioni attuali secondo i date: 10.
La fonte (nome):
Indicatori dello sviluppo mondiale
La fonte (organizzazione):
United Nations Educational, Scientific, and Cultural Organization (UNESCO) Institute for Statistics.
Categorie:
Education, Gender
sono stati aggiornati
23 apr 2017 anni
Indicatori delle variazioni dei valori per anni
In media:
85.794
Minima:
80.139
1 gen 2002 anni
Massimo:
92.778
1 gen 2013 anni
Alla data di osservazione
Valore
Variazione assoluta
La variazione rispetto al valore precedente
1 gen 2002 anni
80.139
+80.139
0.0%
1 gen 2004 anni
85.713
+5.573
6.95%
1 gen 2005 anni
88.539
+2.826
3.3%
1 gen 2006 anni
86.991
-1.548
-1.75%
1 gen 2007 anni
85.369
-1.622
-1.87%
1 gen 2008 anni
85.988
+0.619
0.73%
1 gen 2009 anni
85.872
-0.116
-0.14%
1 gen 2010 anni
83.666
-2.206
-2.57%
1 gen 2013 anni
92.778
+9.112
10.89%
1 gen 2014 anni
82.888
-9.89
-10.66%
Classificazione dei paesi secondo i statistiche attuali per anni