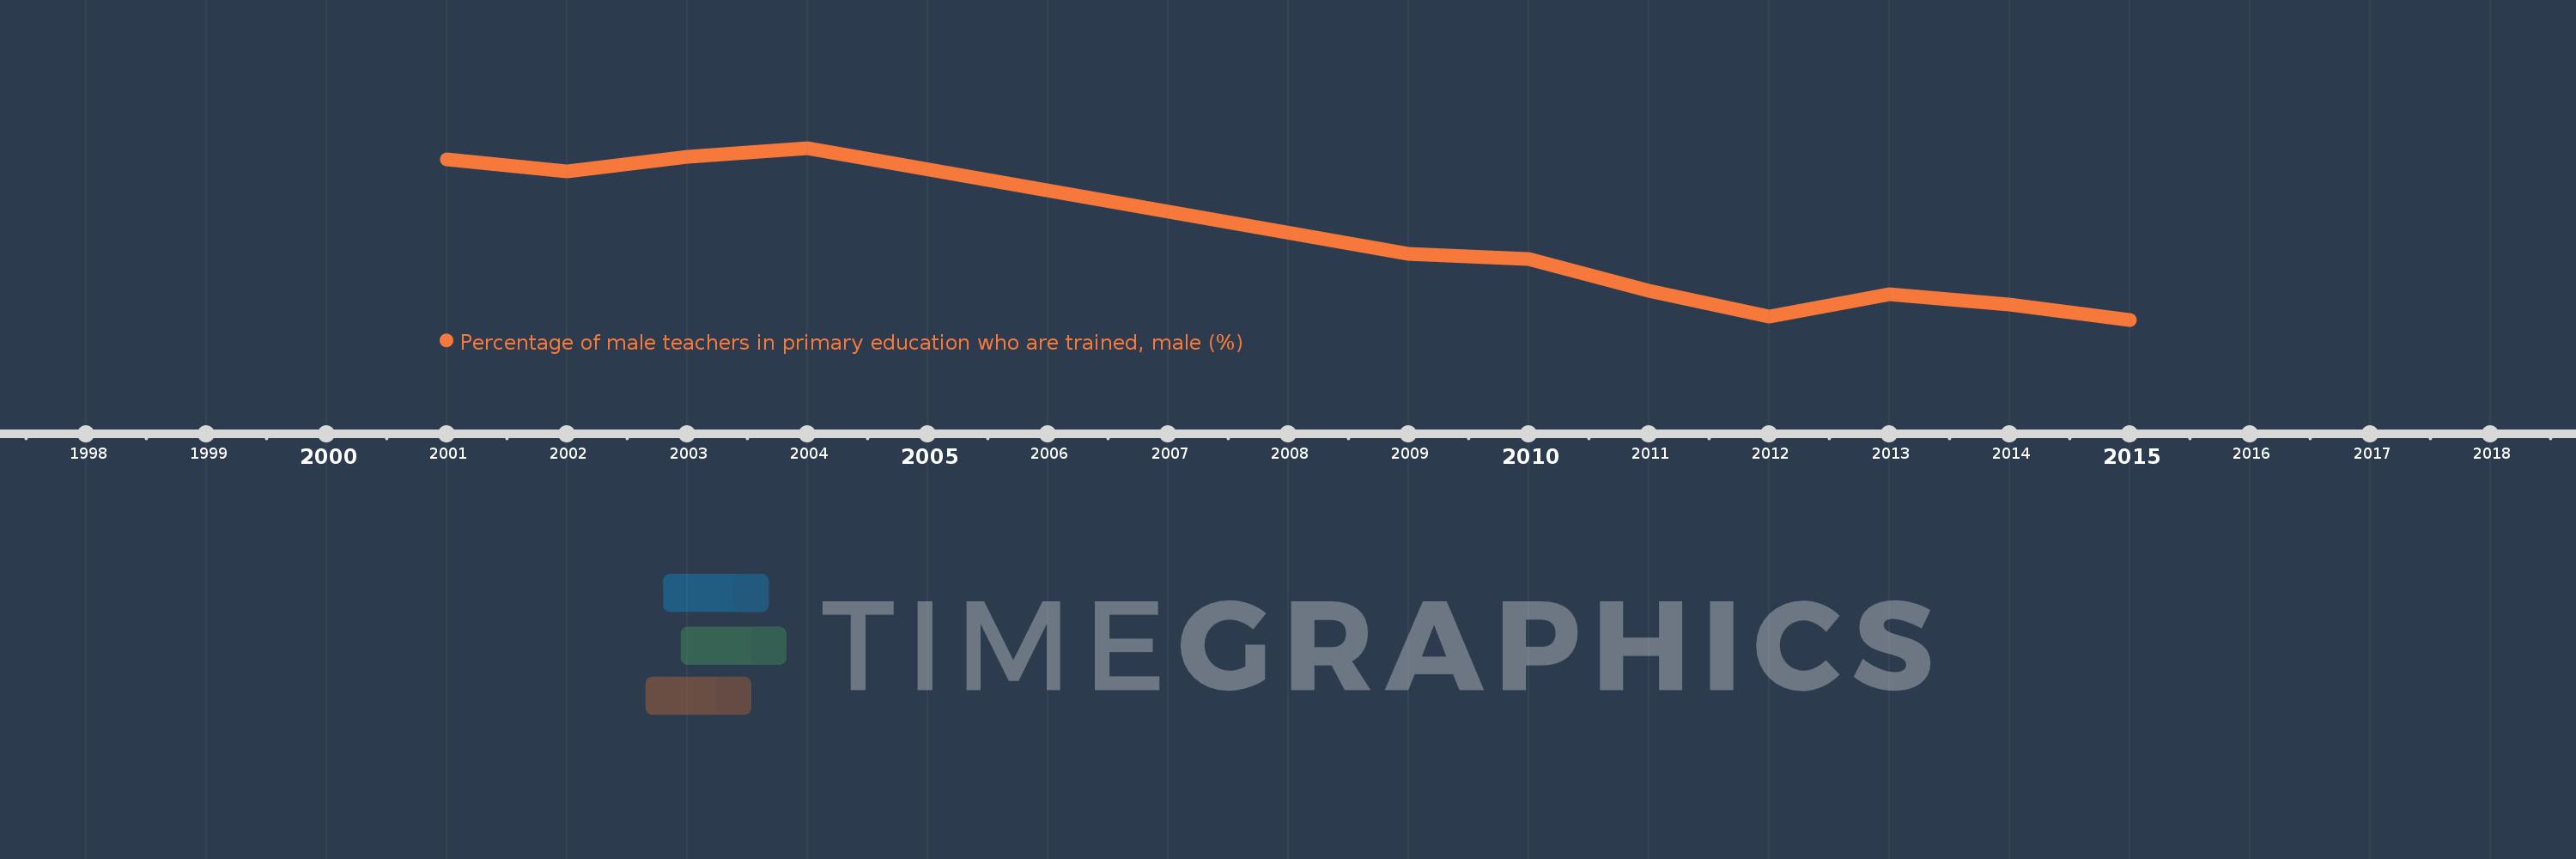
Questa scala temporale mostra un grafico dal 2001 anno al 2015 anno. Fragile and conflict affected situations. I dati fino ad 2000 anno non disponibili. Il numero di osservazioni attuali secondo i date: 11.
La fonte (nome):
Indicatori dello sviluppo mondiale
La fonte (organizzazione):
United Nations Educational, Scientific, and Cultural Organization (UNESCO) Institute for Statistics.
Categorie:
Education, Gender
sono stati aggiornati
23 apr 2017 anni
Indicatori delle variazioni dei valori per anni
In media:
78.888
Minima:
75.143
1 gen 2015 anni
Massimo:
83.535
1 gen 2004 anni
Alla data di osservazione
Valore
Variazione assoluta
La variazione rispetto al valore precedente
1 gen 2001 anni
82.983
+82.983
0.0%
1 gen 2002 anni
82.393
-0.589
-0.71%
1 gen 2003 anni
83.105
+0.711
0.86%
1 gen 2004 anni
83.535
+0.431
0.52%
1 gen 2009 anni
78.349
-5.186
-6.21%
1 gen 2010 anni
78.099
-0.25
-0.32%
1 gen 2011 anni
76.56
-1.539
-1.97%
1 gen 2012 anni
75.3
-1.26
-1.65%
1 gen 2013 anni
76.4
+1.1
1.46%
1 gen 2014 anni
75.904
-0.496
-0.65%
1 gen 2015 anni
75.143
-0.762
-1.0%
Classificazione dei paesi secondo i statistiche attuali per anni