29
/it/
it
AIzaSyAYiBZKx7MnpbEhh9jyipgxe19OcubqV5w
April 1, 2024
86369
Bhutan
BTN
true
2
1
Percentage of male teachers in primary education who are trained, male (%)
2007,2006,2002,2001,2000,1999
Download
Biblioteca di statistiche globali →Bhutan →

Percentage of male teachers in primary education who are trained, male (%)

Queste statistiche in altri paesi:
AlgeriaAndorraAngolaAntigua and BarbudaArab WorldArmeniaArubaAzerbaijanBahamas, TheBahrainBangladeshBarbadosBelarusBelizeBeninBermudaBhutanBoliviaBotswanaBritish Virgin IslandsBrunei DarussalamBurkina FasoBurundiCabo VerdeCambodiaCameroonCaribbean small statesCayman IslandsCentral African RepublicColombiaComorosCongo, Dem. Rep.Congo, Rep.Costa RicaCote d'IvoireCroatiaCubaDjiboutiDominicaDominican RepublicEcuadorEgypt, Arab Rep.El SalvadorEquatorial GuineaEritreaEthiopiaFijiFragile and conflict affected situationsGabonGambia, TheGeorgiaGhanaGibraltarGrenadaGuineaGuinea-BissauGuyanaHeavily indebted poor countries (HIPC)HondurasHong Kong SAR, ChinaIDA blendIDA onlyIDA totalIran, Islamic Rep.IraqJamaicaKazakhstanKenyaKiribatiKuwaitKyrgyz RepublicLao PDRLeast developed countries: UN classificationLebanonLesothoLiberiaLow incomeMacao SAR, ChinaMadagascarMalawiMalaysiaMaldivesMaliMauritaniaMauritiusMiddle East & North AfricaMiddle East & North Africa (excluding high income)Middle East & North Africa (IDA & IBRD countries)MoldovaMongoliaMoroccoMozambiqueMyanmarNamibiaNauruNepalNicaraguaNigerNigeriaOmanOther small statesPacific island small statesPakistanPanamaParaguayPhilippinesPre-demographic dividendQatarRwandaSao Tome and PrincipeSaudi ArabiaSenegalSerbiaSeychellesSierra LeoneSingaporeSmall statesSolomon IslandsSouth AfricaSt. Kitts and NevisSt. LuciaSt. Vincent and the GrenadinesSub-Saharan Africa Sub-Saharan Africa (excluding high income)Sub-Saharan Africa (IDA & IBRD countries)SurinameSwazilandSyrian Arab RepublicTajikistanTanzaniaTogoTongaTrinidad and TobagoTunisiaTurks and Caicos IslandsUgandaUnited Arab EmiratesUzbekistanVietnamWest Bank and GazaZambiaZimbabwe
Linea del tempo:
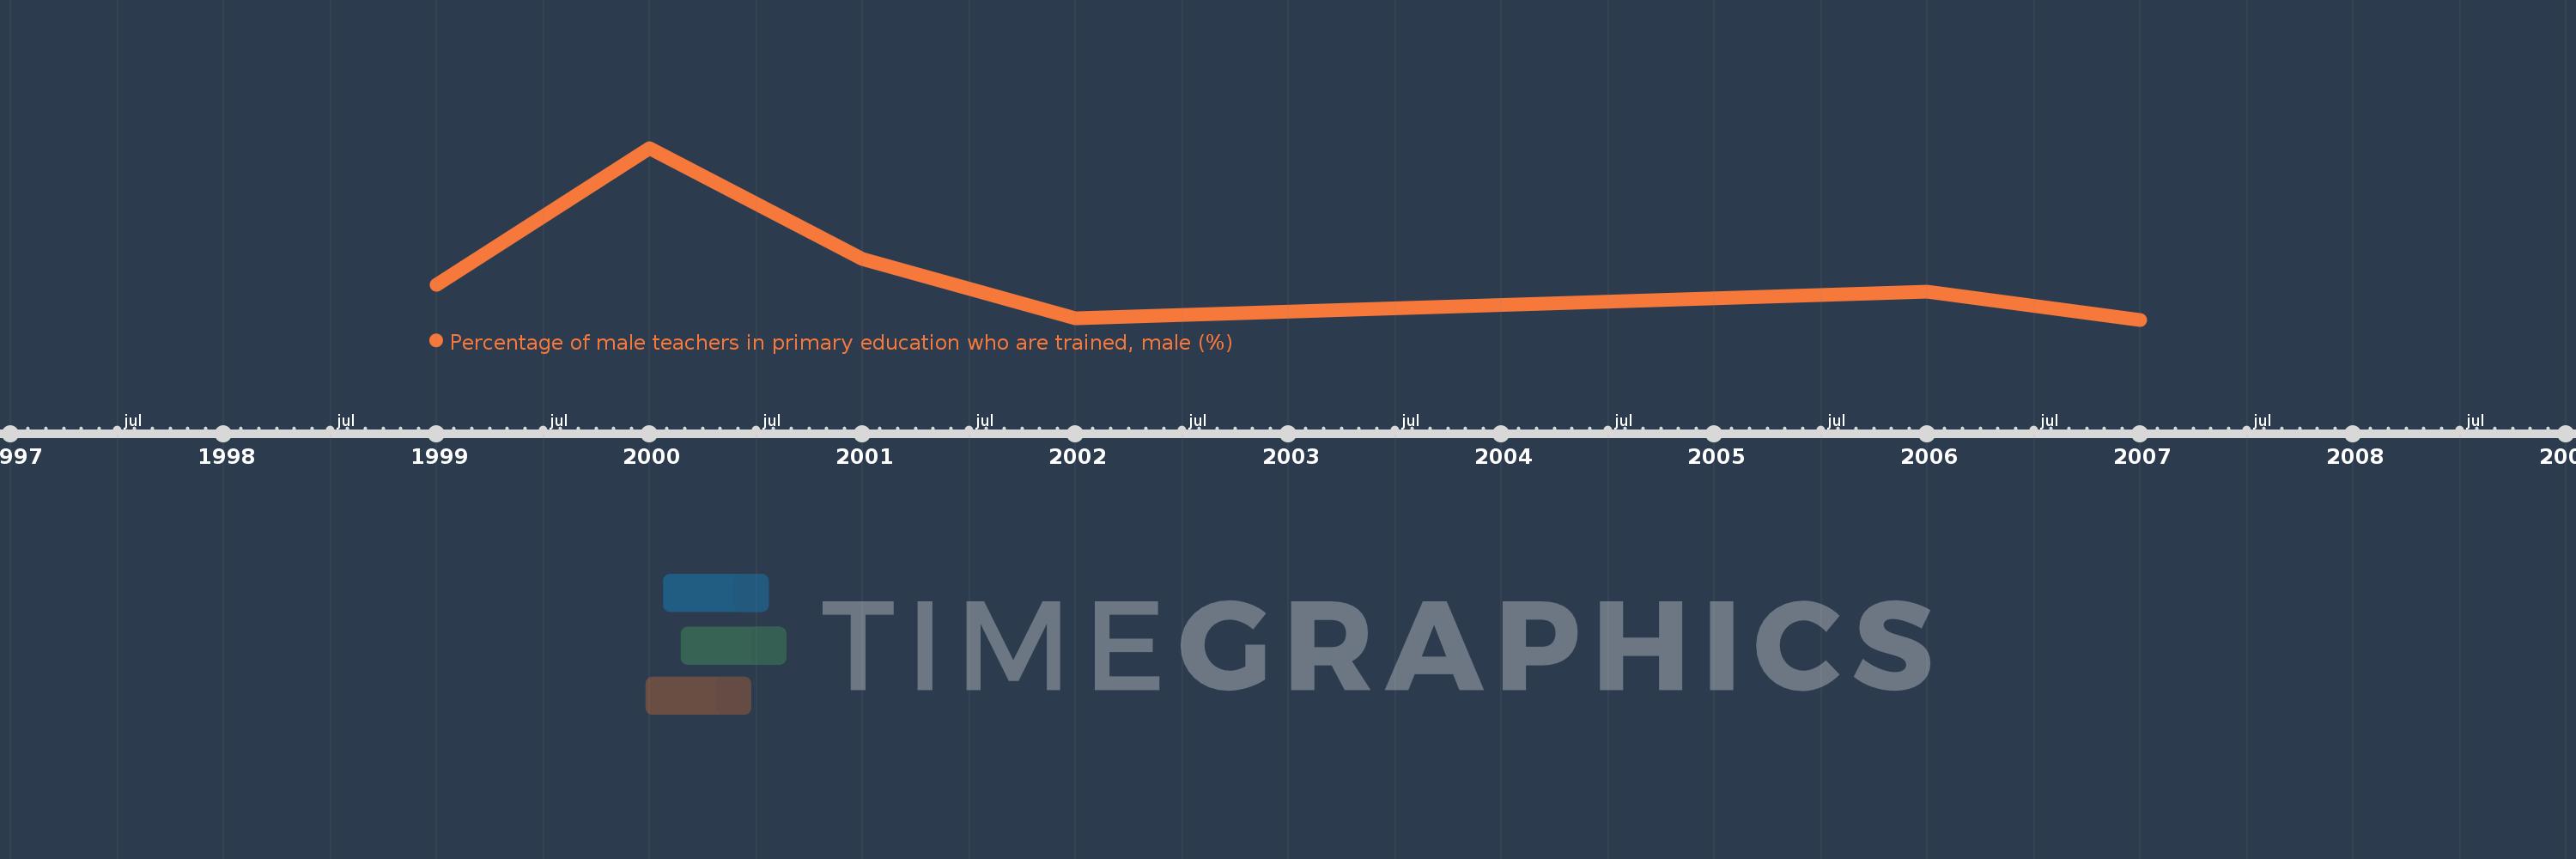
Questa scala temporale mostra un grafico dal 1999 anno al 2007 anno. Bhutan. I dati fino ad 1998 anno non disponibili. Il numero di osservazioni attuali secondo i date: 6.
La fonte (nome):
Indicatori dello sviluppo mondiale
La fonte (organizzazione):
United Nations Educational, Scientific, and Cultural Organization (UNESCO) Institute for Statistics.
Categorie:
Education, Gender
sono stati aggiornati
23 apr 2017 anni
Indicatori delle variazioni dei valori per anni
In media:
94.293
Minima:
91.98
1 gen 2007 anni
Massimo:
100.0
1 gen 2000 anni
Alla data di osservazione
Valore
Variazione assoluta
La variazione rispetto al valore precedente
1 gen 1999 anni
93.614
+93.614
0.0%
1 gen 2000 anni
100.0
+6.386
6.82%
1 gen 2001 anni
94.834
-5.166
-5.17%
1 gen 2002 anni
92.047
-2.787
-2.94%
1 gen 2006 anni
93.283
+1.236
1.34%
1 gen 2007 anni
91.98
-1.303
-1.4%
Classificazione dei paesi secondo i statistiche attuali per anni

Commenti:

Inviare
PremiumAbout & FeedbackAccordoPrivatezza
logo
© 2022 Selected Technologies LLC – Morgan Hill, California