Download Queste statistiche in altri paesi:
Linea del tempo:
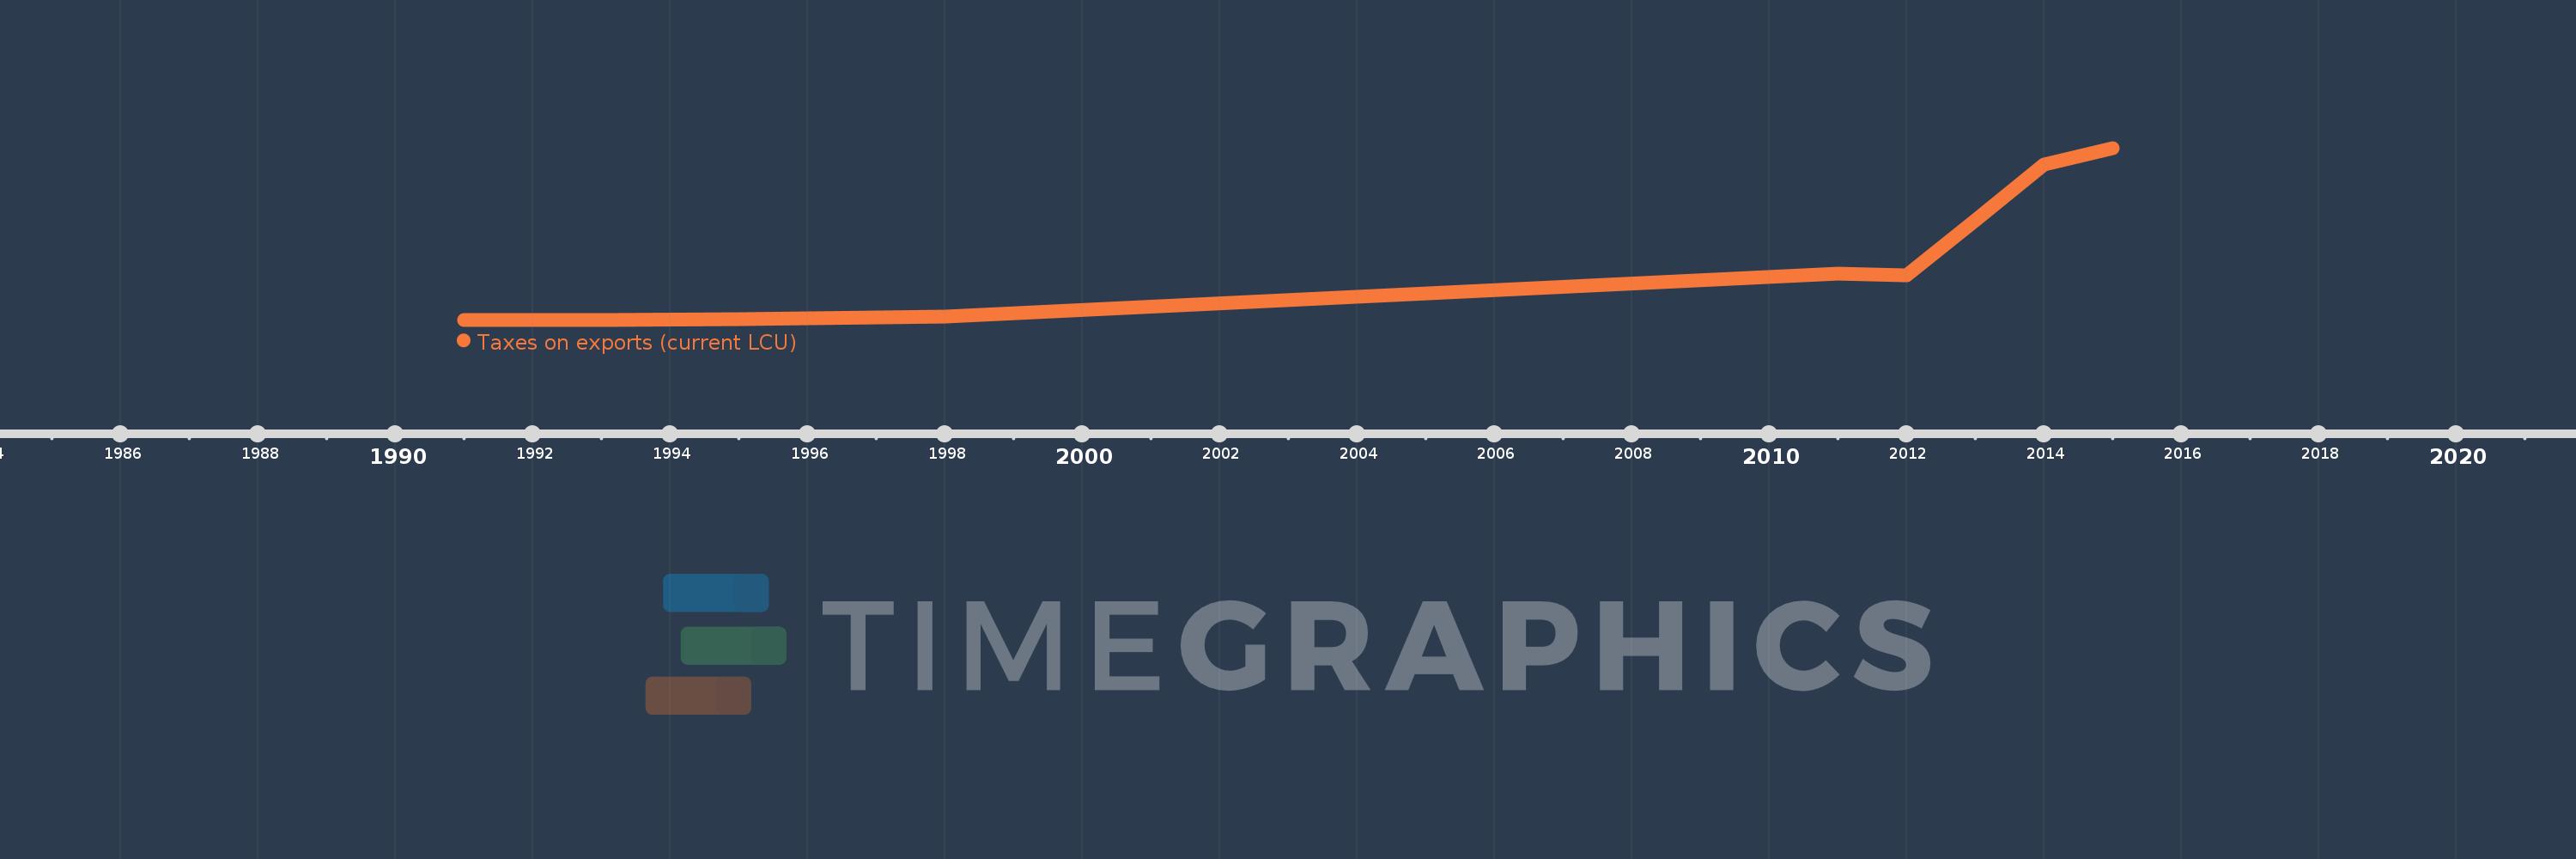
Questa scala temporale mostra un grafico dal 1991 anno al 2015 anno. Brazil. I dati fino ad 1990 anno non disponibili. Il numero di osservazioni attuali secondo i date: 10.
La fonte (nome):
Indicatori dello sviluppo mondiale
La fonte (organizzazione):
International Monetary Fund, Government Finance Statistics Yearbook and data files.
Categorie:
Public Sector
sono stati aggiornati
23 apr 2017 anni
Indicatori delle variazioni dei valori per anni
Minima:
1.018 Mille.
1 gen 1991 anni
Massimo:
162.124 Mln
1 gen 2015 anni
Alla data di osservazione
Valore
Variazione assoluta
La variazione rispetto al valore precedente
1 gen 1991 anni
1.018 Mille.
+1.018 Mille.
0.0%
1 gen 1992 anni
1.527 Mille.
+509.091
50.0%
1 gen 1993 anni
1.2 Mille.
-327.273
-21.43%
1 gen 1995 anni
400.0 Mille.
+398.8 Mille.
33.23 Mille.%
1 gen 1998 anni
2.9 Mln
+2.5 Mln
625.0%
1 gen 2011 anni
43.872 Mln
+40.972 Mln
1.41 Mille.%
1 gen 2012 anni
41.778 Mln
-2.094 Mln
-4.77%
1 gen 2013 anni
93.582 Mln
+51.804 Mln
124.0%
1 gen 2014 anni
146.099 Mln
+52.517 Mln
56.12%
1 gen 2015 anni
162.124 Mln
+16.025 Mln
10.97%
Classificazione dei paesi secondo i statistiche attuali per anni