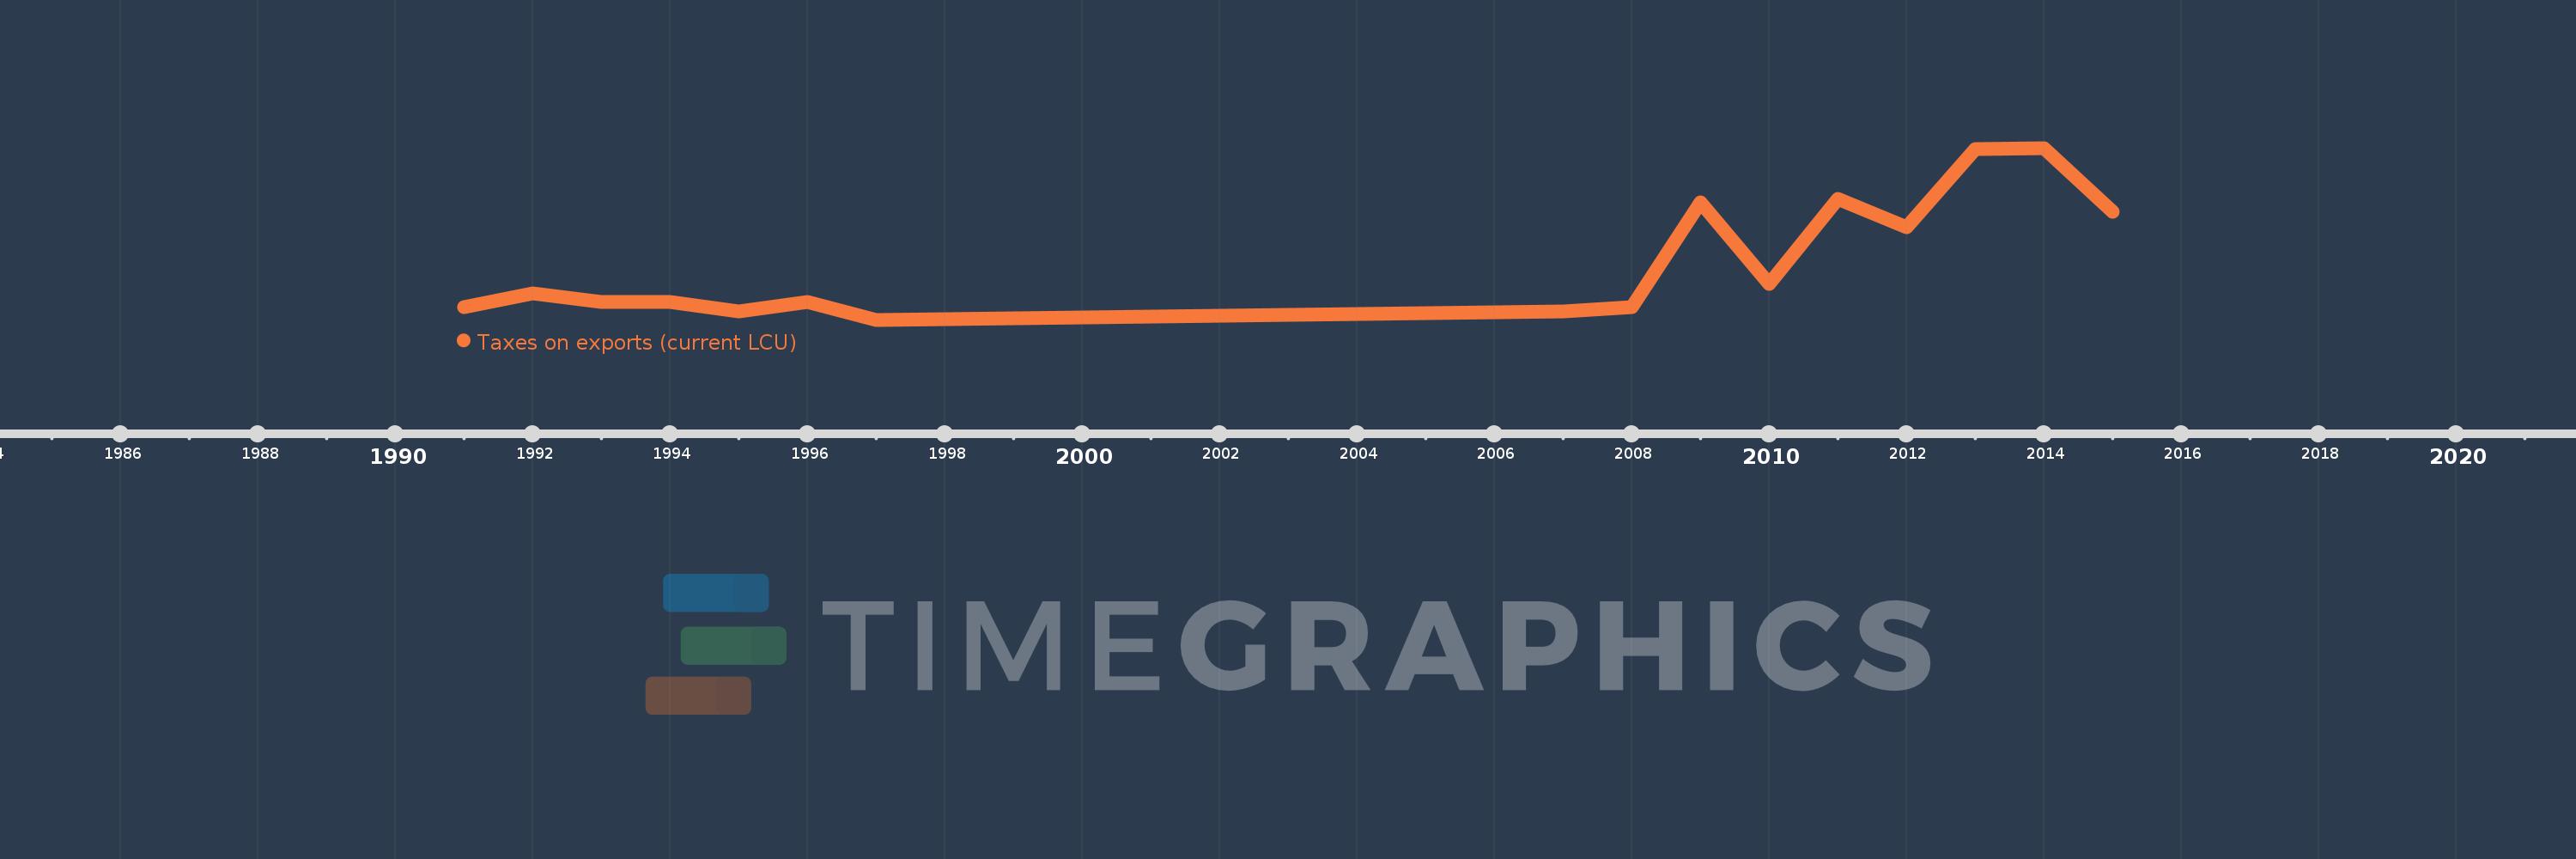
Questa scala temporale mostra un grafico dal 1991 anno al 2015 anno. Botswana. I dati fino ad 1990 anno non disponibili. Il numero di osservazioni attuali secondo i date: 16.
La fonte (nome):
Indicatori dello sviluppo mondiale
La fonte (organizzazione):
International Monetary Fund, Government Finance Statistics Yearbook and data files.
Categorie:
Public Sector
sono stati aggiornati
23 apr 2017 anni
Indicatori delle variazioni dei valori per anni
In media:
972.5 Mille.
Minima:
300.0 Mille.
1 gen 1997 anni
Massimo:
2.27 Mln
1 gen 2014 anni
Alla data di osservazione
Valore
Variazione assoluta
La variazione rispetto al valore precedente
1 gen 1991 anni
440.0 Mille.
+440.0 Mille.
0.0%
1 gen 1992 anni
600.0 Mille.
+160.0 Mille.
36.36%
1 gen 1993 anni
500.0 Mille.
-100.0 Mille.
-16.67%
1 gen 1994 anni
500.0 Mille.
0.0
0.0%
1 gen 1995 anni
400.0 Mille.
-100.0 Mille.
-20.0%
1 gen 1996 anni
500.0 Mille.
+100.0 Mille.
25.0%
1 gen 1997 anni
300.0 Mille.
-200.0 Mille.
-40.0%
1 gen 2007 anni
400.0 Mille.
+100.0 Mille.
33.33%
1 gen 2008 anni
440.0 Mille.
+40.0 Mille.
10.0%
1 gen 2009 anni
1.65 Mln
+1.21 Mln
275.0%
1 gen 2010 anni
710.0 Mille.
-940.0 Mille.
-56.97%
1 gen 2011 anni
1.69 Mln
+980.0 Mille.
138.03%
1 gen 2012 anni
1.36 Mln
-330.0 Mille.
-19.53%
1 gen 2013 anni
2.26 Mln
+900.0 Mille.
66.18%
1 gen 2014 anni
2.27 Mln
+10.0 Mille.
0.44%
1 gen 2015 anni
1.54 Mln
-730.0 Mille.
-32.16%
Classificazione dei paesi secondo i statistiche attuali per anni