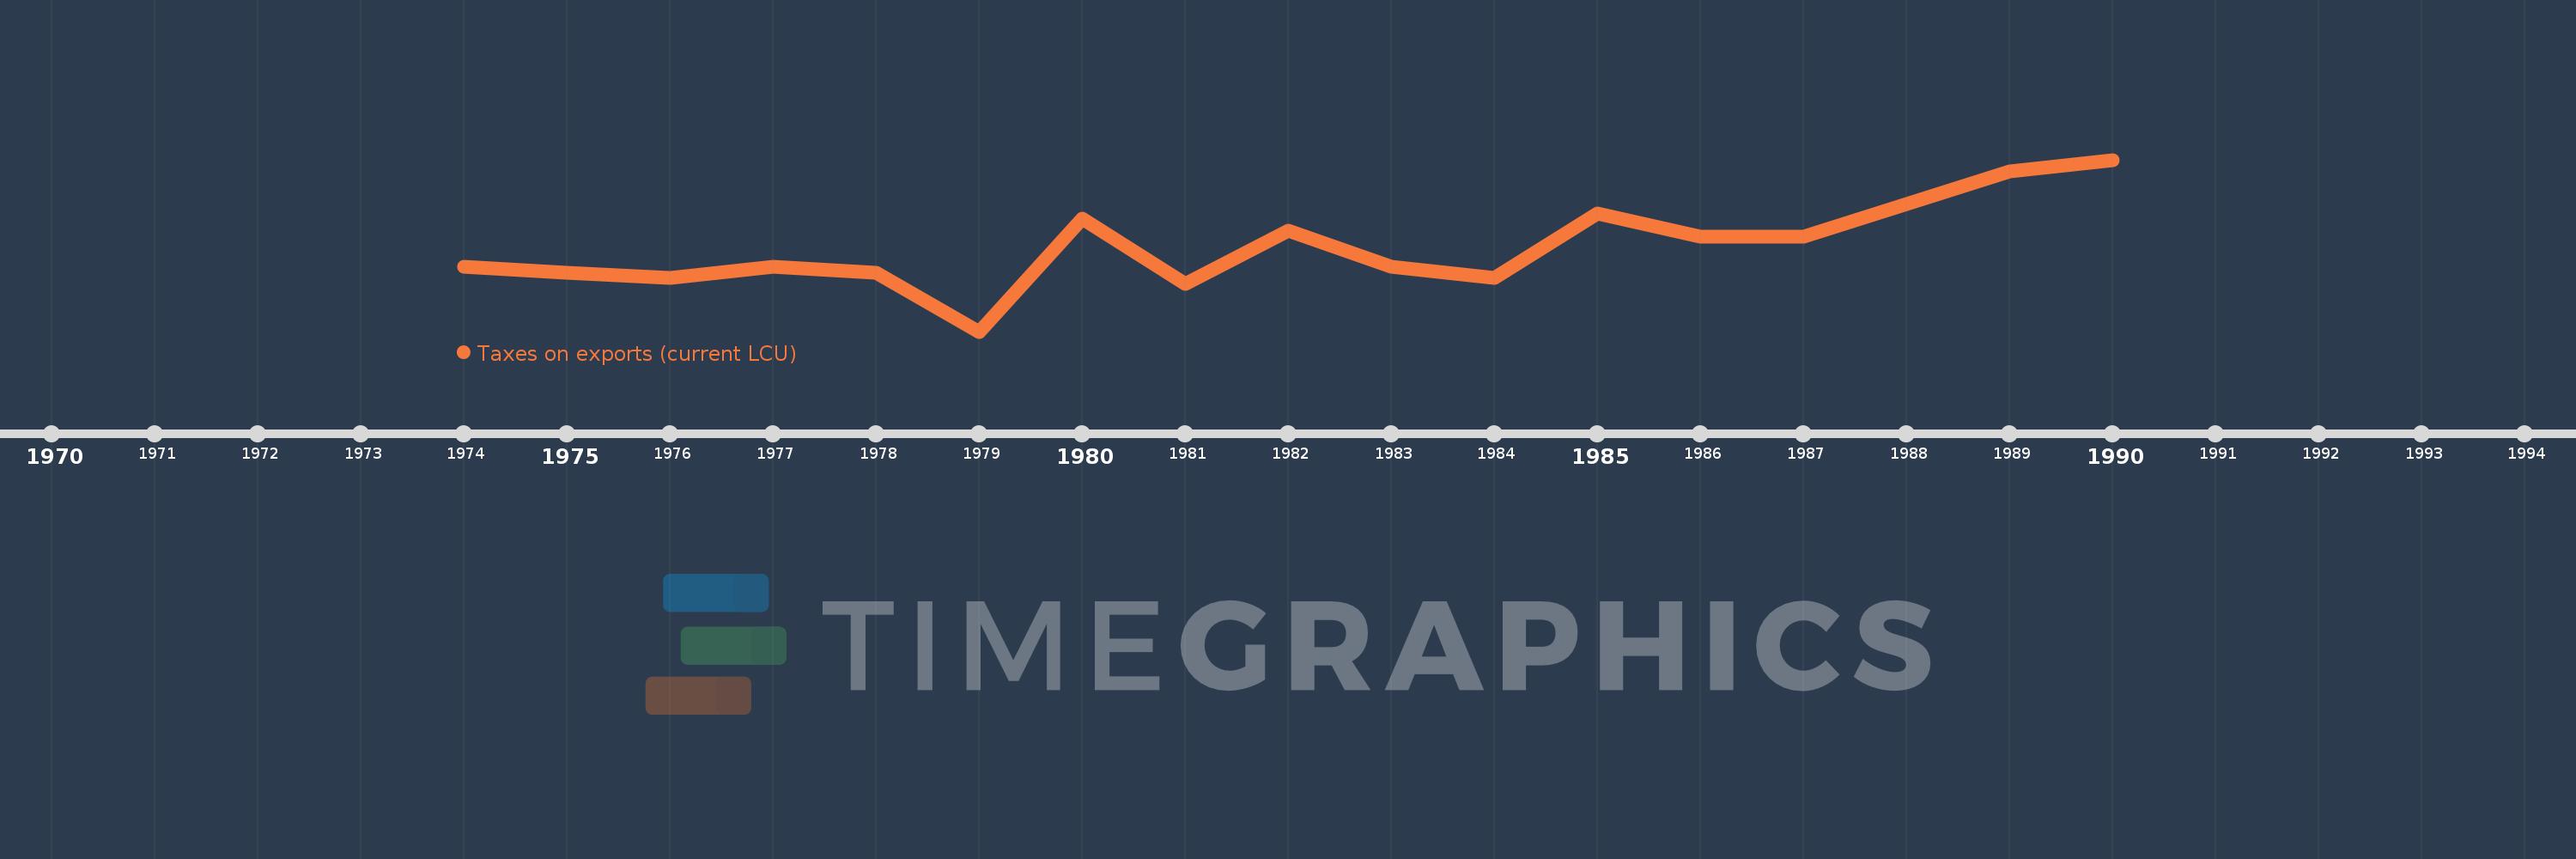
Questa scala temporale mostra un grafico dal 1974 anno al 1990 anno. Bahamas, The. I dati fino ad 1973 anno non disponibili. Il numero di osservazioni attuali secondo i date: 16.
La fonte (nome):
Indicatori dello sviluppo mondiale
La fonte (organizzazione):
International Monetary Fund, Government Finance Statistics Yearbook and data files.
Categorie:
Public Sector
sono stati aggiornati
23 apr 2017 anni
Indicatori delle variazioni dei valori per anni
In media:
3.494 Mln
Minima:
2.1 Mln
1 gen 1979 anni
Massimo:
5.0 Mln
1 gen 1990 anni
Alla data di osservazione
Valore
Variazione assoluta
La variazione rispetto al valore precedente
1 gen 1974 anni
3.2 Mln
+3.2 Mln
0.0%
1 gen 1975 anni
3.1 Mln
-100.0 Mille.
-3.13%
1 gen 1976 anni
3.0 Mln
-100.0 Mille.
-3.23%
1 gen 1977 anni
3.2 Mln
+200.0 Mille.
6.67%
1 gen 1978 anni
3.1 Mln
-100.0 Mille.
-3.13%
1 gen 1979 anni
2.1 Mln
-1000.0 Mille.
-32.26%
1 gen 1980 anni
4.0 Mln
+1.9 Mln
90.48%
1 gen 1981 anni
2.9 Mln
-1.1 Mln
-27.5%
1 gen 1982 anni
3.8 Mln
+900.0 Mille.
31.03%
1 gen 1983 anni
3.2 Mln
-600.0 Mille.
-15.79%
1 gen 1984 anni
3.0 Mln
-200.0 Mille.
-6.25%
1 gen 1985 anni
4.1 Mln
+1.1 Mln
36.67%
1 gen 1986 anni
3.7 Mln
-400.0 Mille.
-9.76%
1 gen 1987 anni
3.7 Mln
0.0
0.0%
1 gen 1989 anni
4.8 Mln
+1.1 Mln
29.73%
1 gen 1990 anni
5.0 Mln
+200.0 Mille.
4.17%
Classificazione dei paesi secondo i statistiche attuali per anni