Download Queste statistiche in altri paesi:
Linea del tempo:
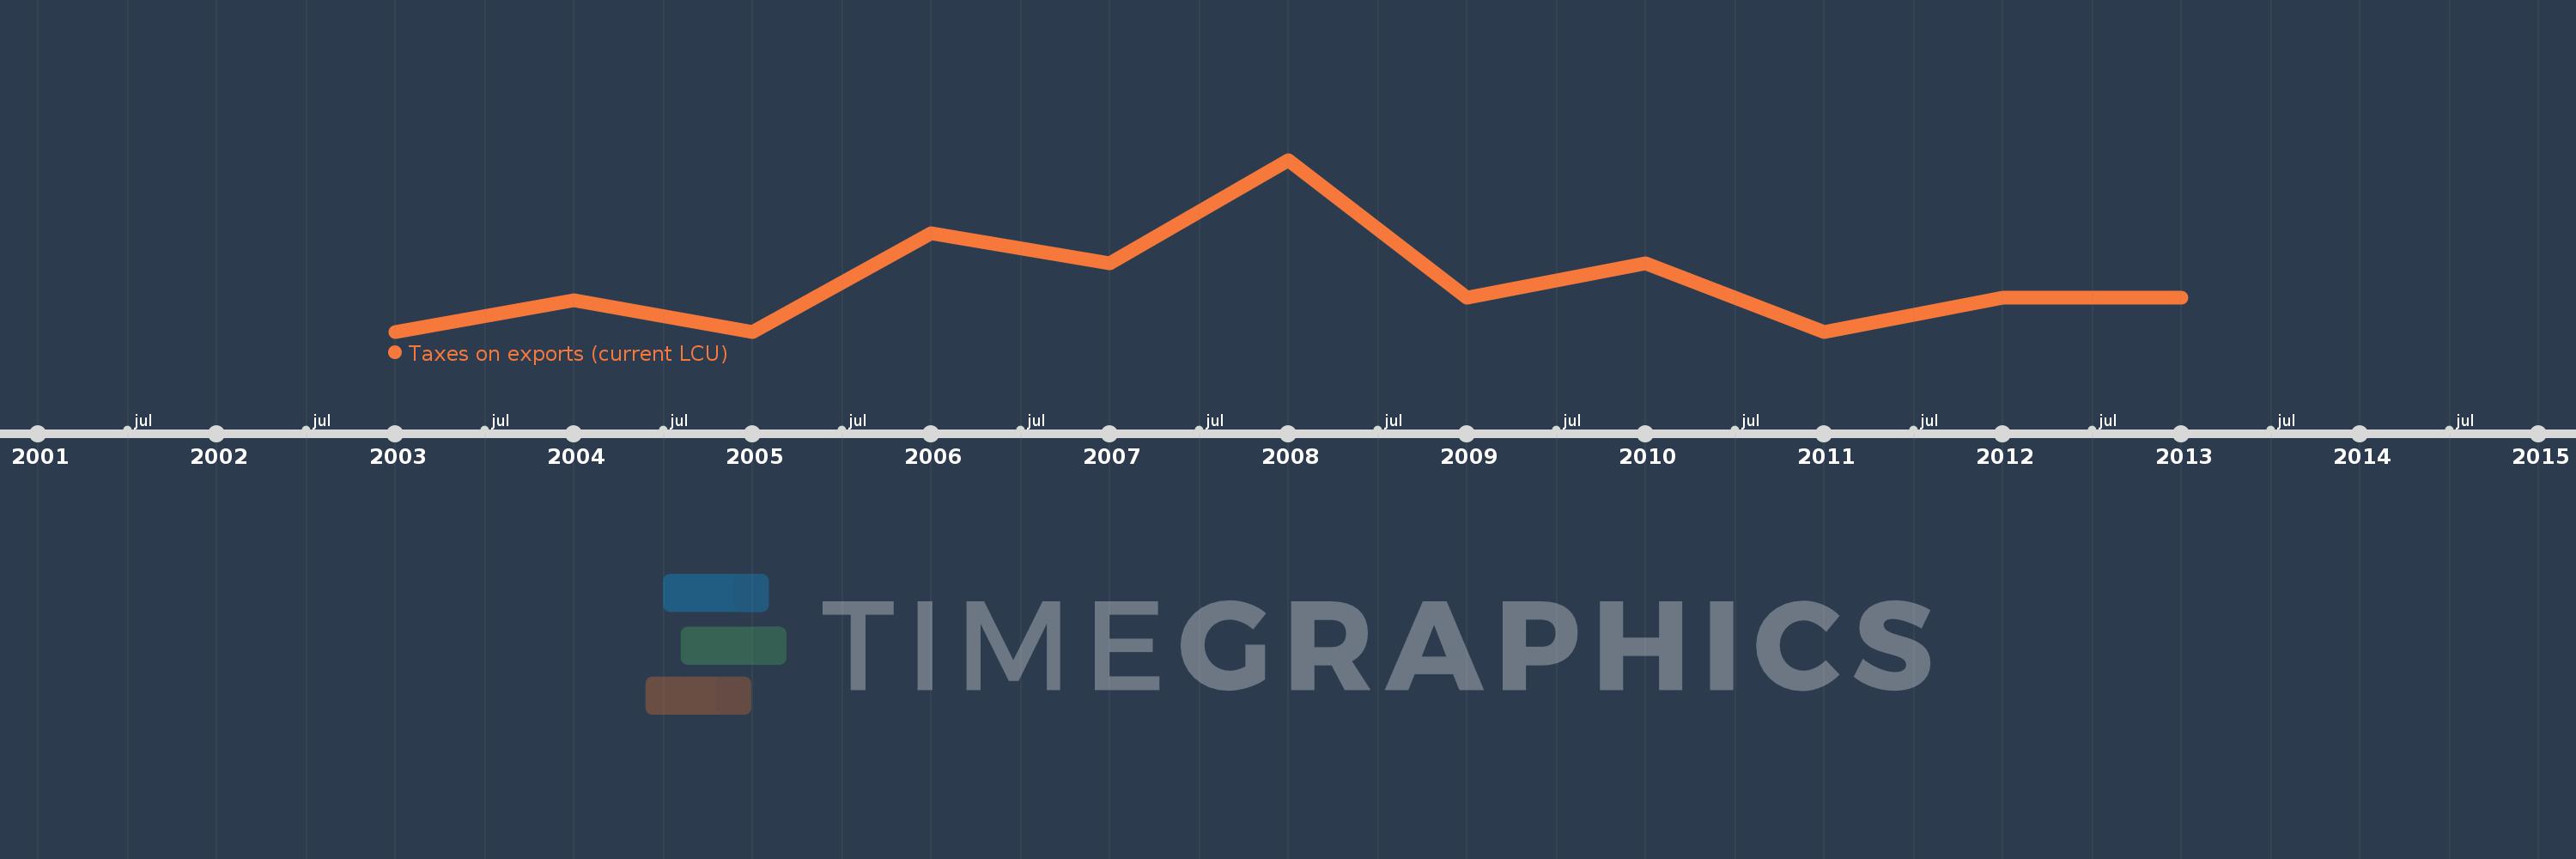
Questa scala temporale mostra un grafico dal 2003 anno al 2013 anno. Swaziland. I dati fino ad 2002 anno non disponibili. Il numero di osservazioni attuali secondo i date: 11.
La fonte (nome):
Indicatori dello sviluppo mondiale
La fonte (organizzazione):
International Monetary Fund, Government Finance Statistics Yearbook and data files.
Categorie:
Public Sector
sono stati aggiornati
23 apr 2017 anni
Indicatori delle variazioni dei valori per anni
Minima:
1000.0
1 gen 2003 anni
Massimo:
11.0 Mille.
1 gen 2008 anni
Alla data di osservazione
Valore
Variazione assoluta
La variazione rispetto al valore precedente
1 gen 2003 anni
1000.0
+1000.0
0.0%
1 gen 2004 anni
2.85 Mille.
+1.85 Mille.
185.0%
1 gen 2005 anni
1000.0
-1.85 Mille.
-64.91%
1 gen 2006 anni
6.713 Mille.
+5.713 Mille.
571.3%
1 gen 2007 anni
5.0 Mille.
-1.713 Mille.
-25.52%
1 gen 2008 anni
11.0 Mille.
+6.0 Mille.
120.0%
1 gen 2009 anni
3.0 Mille.
-8.0 Mille.
-72.73%
1 gen 2010 anni
5.0 Mille.
+2.0 Mille.
66.67%
1 gen 2011 anni
1000.0
-4.0 Mille.
-80.0%
1 gen 2012 anni
3.0 Mille.
+2.0 Mille.
200.0%
1 gen 2013 anni
3.0 Mille.
0.0
0.0%
Classificazione dei paesi secondo i statistiche attuali per anni