Download Queste statistiche in altri paesi:
Linea del tempo:
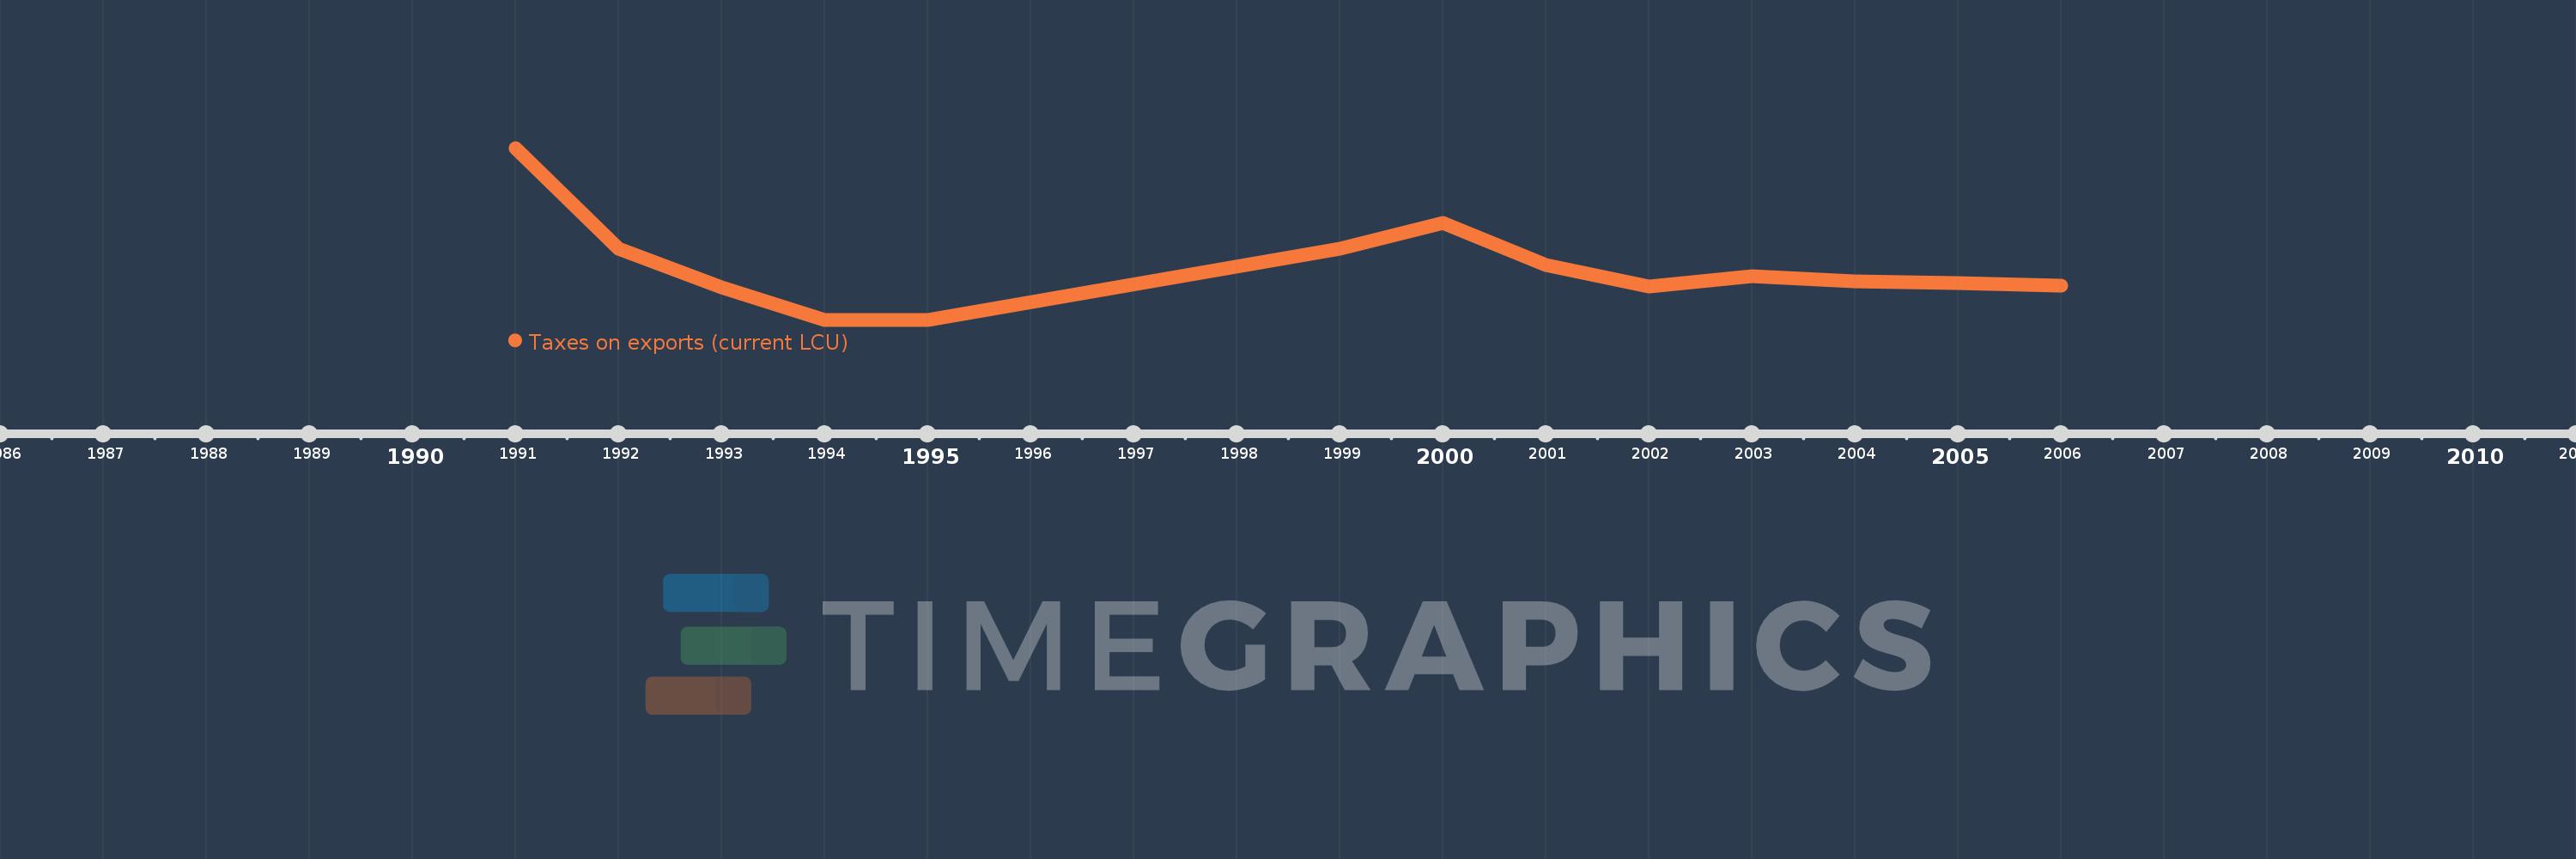
Questa scala temporale mostra un grafico dal 1991 anno al 2006 anno. Guatemala. I dati fino ad 1990 anno non disponibili. Il numero di osservazioni attuali secondo i date: 13.
La fonte (nome):
Indicatori dello sviluppo mondiale
La fonte (organizzazione):
International Monetary Fund, Government Finance Statistics Yearbook and data files.
Categorie:
Public Sector
sono stati aggiornati
23 apr 2017 anni
Indicatori delle variazioni dei valori per anni
Minima:
10.0 Mille.
1 gen 1994 anni
Massimo:
4.63 Mln
1 gen 1991 anni
Alla data di osservazione
Valore
Variazione assoluta
La variazione rispetto al valore precedente
1 gen 1991 anni
4.63 Mln
+4.63 Mln
0.0%
1 gen 1992 anni
1.92 Mln
-2.71 Mln
-58.53%
1 gen 1993 anni
880.0 Mille.
-1.04 Mln
-54.17%
1 gen 1994 anni
10.0 Mille.
-870.0 Mille.
-98.86%
1 gen 1995 anni
10.0 Mille.
0.0
0.0%
1 gen 1999 anni
1.91 Mln
+1.9 Mln
19.0 Mille.%
1 gen 2000 anni
2.61 Mln
+700.0 Mille.
36.65%
1 gen 2001 anni
1.49 Mln
-1.12 Mln
-42.91%
1 gen 2002 anni
900.0 Mille.
-590.0 Mille.
-39.6%
1 gen 2003 anni
1.19 Mln
+290.0 Mille.
32.22%
1 gen 2004 anni
1.04 Mln
-150.0 Mille.
-12.61%
1 gen 2005 anni
1000.0 Mille.
-40.0 Mille.
-3.85%
1 gen 2006 anni
930.0 Mille.
-70.0 Mille.
-7.0%
Classificazione dei paesi secondo i statistiche attuali per anni