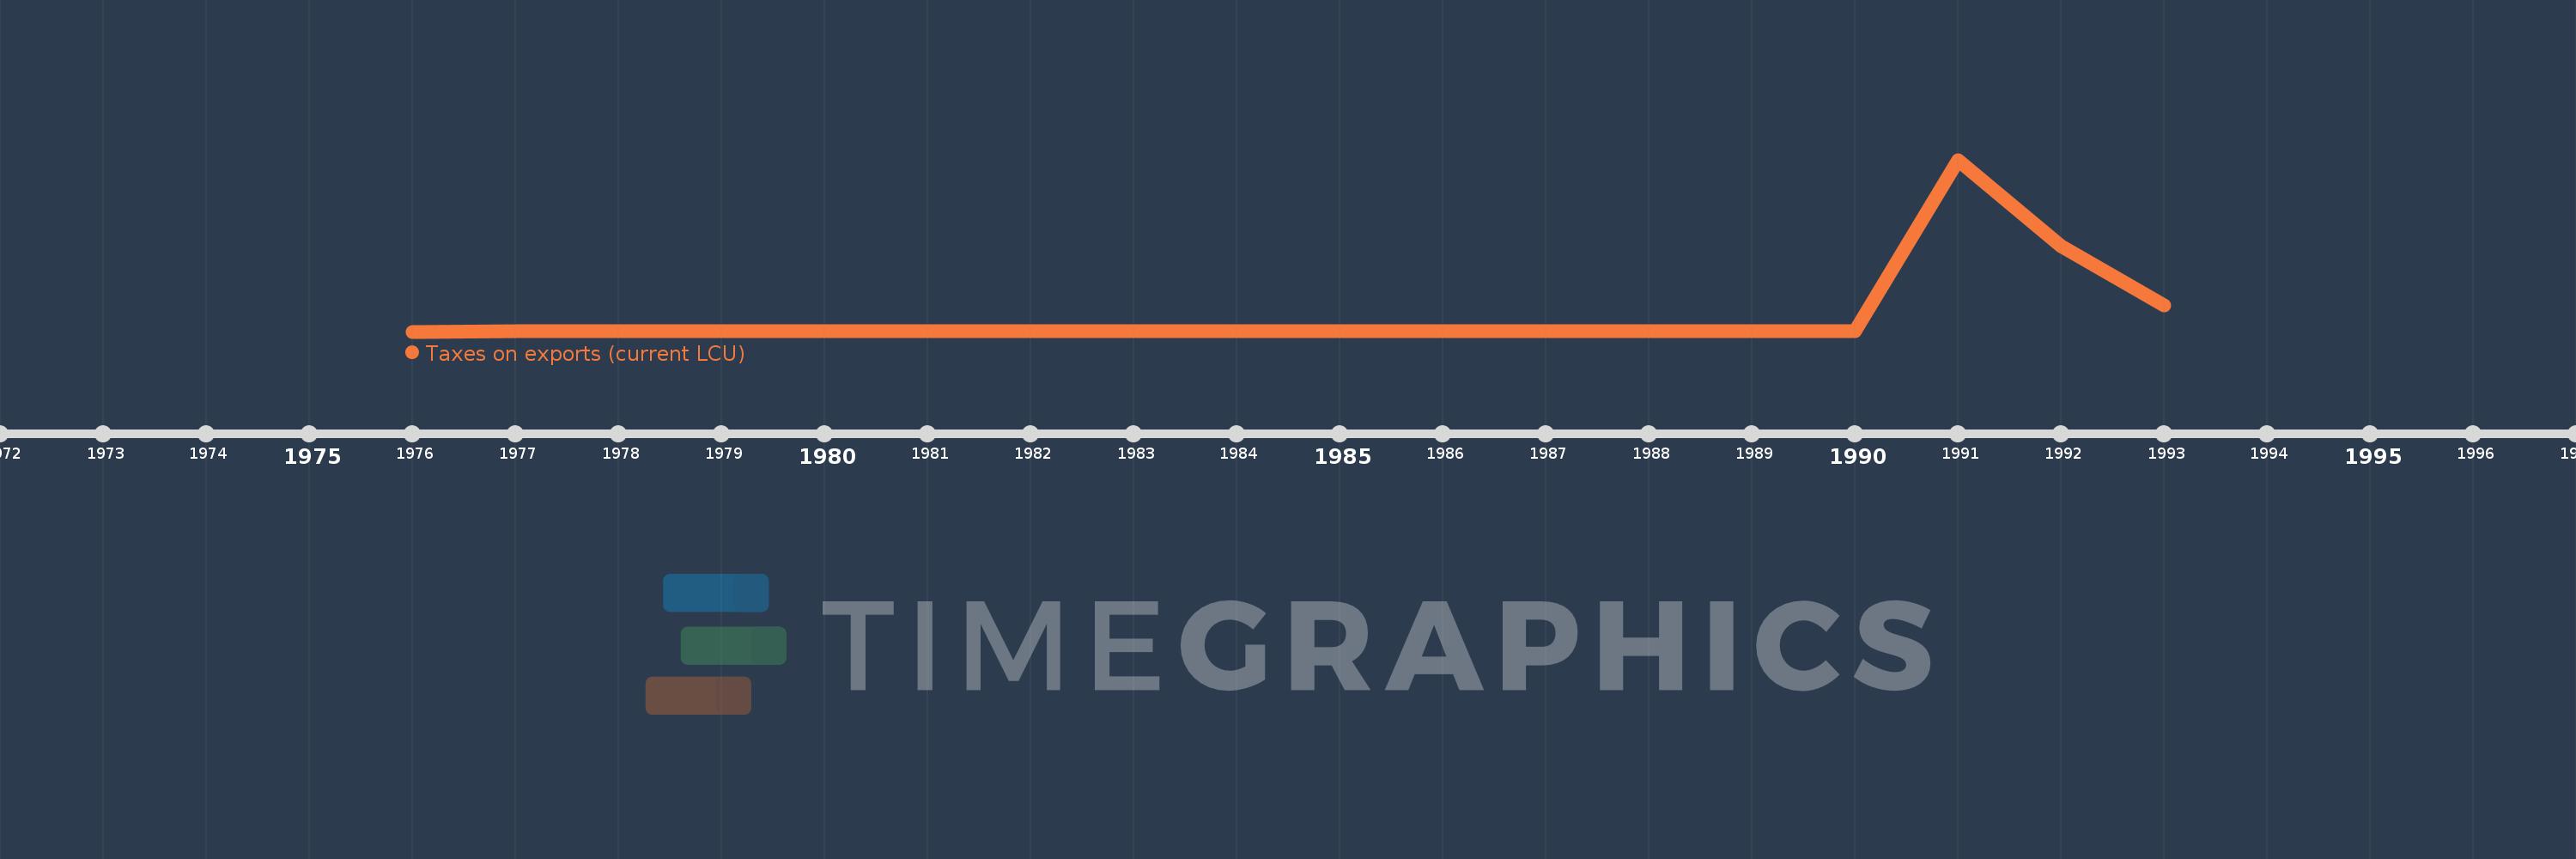
Questa scala temporale mostra un grafico dal 1976 anno al 1993 anno. Peru. I dati fino ad 1975 anno non disponibili. Il numero di osservazioni attuali secondo i date: 18.
La fonte (nome):
Indicatori dello sviluppo mondiale
La fonte (organizzazione):
International Monetary Fund, Government Finance Statistics Yearbook and data files.
Categorie:
Public Sector
sono stati aggiornati
23 apr 2017 anni
Indicatori delle variazioni dei valori per anni
In media:
4.464 Mln
Minima:
1.0
1 gen 1976 anni
Massimo:
48.61 Mln
1 gen 1991 anni
Alla data di osservazione
Valore
Variazione assoluta
La variazione rispetto al valore precedente
1 gen 1976 anni
1.0
+1.0
0.0%
1 gen 1977 anni
6.0
+5.0
500.0%
1 gen 1978 anni
18.0
+12.0
200.0%
1 gen 1979 anni
32.0
+14.0
77.78%
1 gen 1980 anni
88.0
+56.0
175.0%
1 gen 1981 anni
123.0
+35.0
39.77%
1 gen 1982 anni
116.0
-7.0
-5.69%
1 gen 1983 anni
119.0
+3.0
2.59%
1 gen 1984 anni
98.0
-21.0
-17.65%
1 gen 1985 anni
81.0
-17.0
-17.35%
1 gen 1986 anni
576.0
+495.0
611.11%
1 gen 1987 anni
653.0
+77.0
13.37%
1 gen 1988 anni
239.0
-414.0
-63.4%
1 gen 1989 anni
3.0 Mille.
+2.761 Mille.
1.16 Mille.%
1 gen 1990 anni
109.0 Mille.
+106.0 Mille.
3.53 Mille.%
1 gen 1991 anni
48.61 Mln
+48.501 Mln
44.5 Mille.%
1 gen 1992 anni
24.15 Mln
-24.46 Mln
-50.32%
1 gen 1993 anni
7.48 Mln
-16.67 Mln
-69.03%
Classificazione dei paesi secondo i statistiche attuali per anni