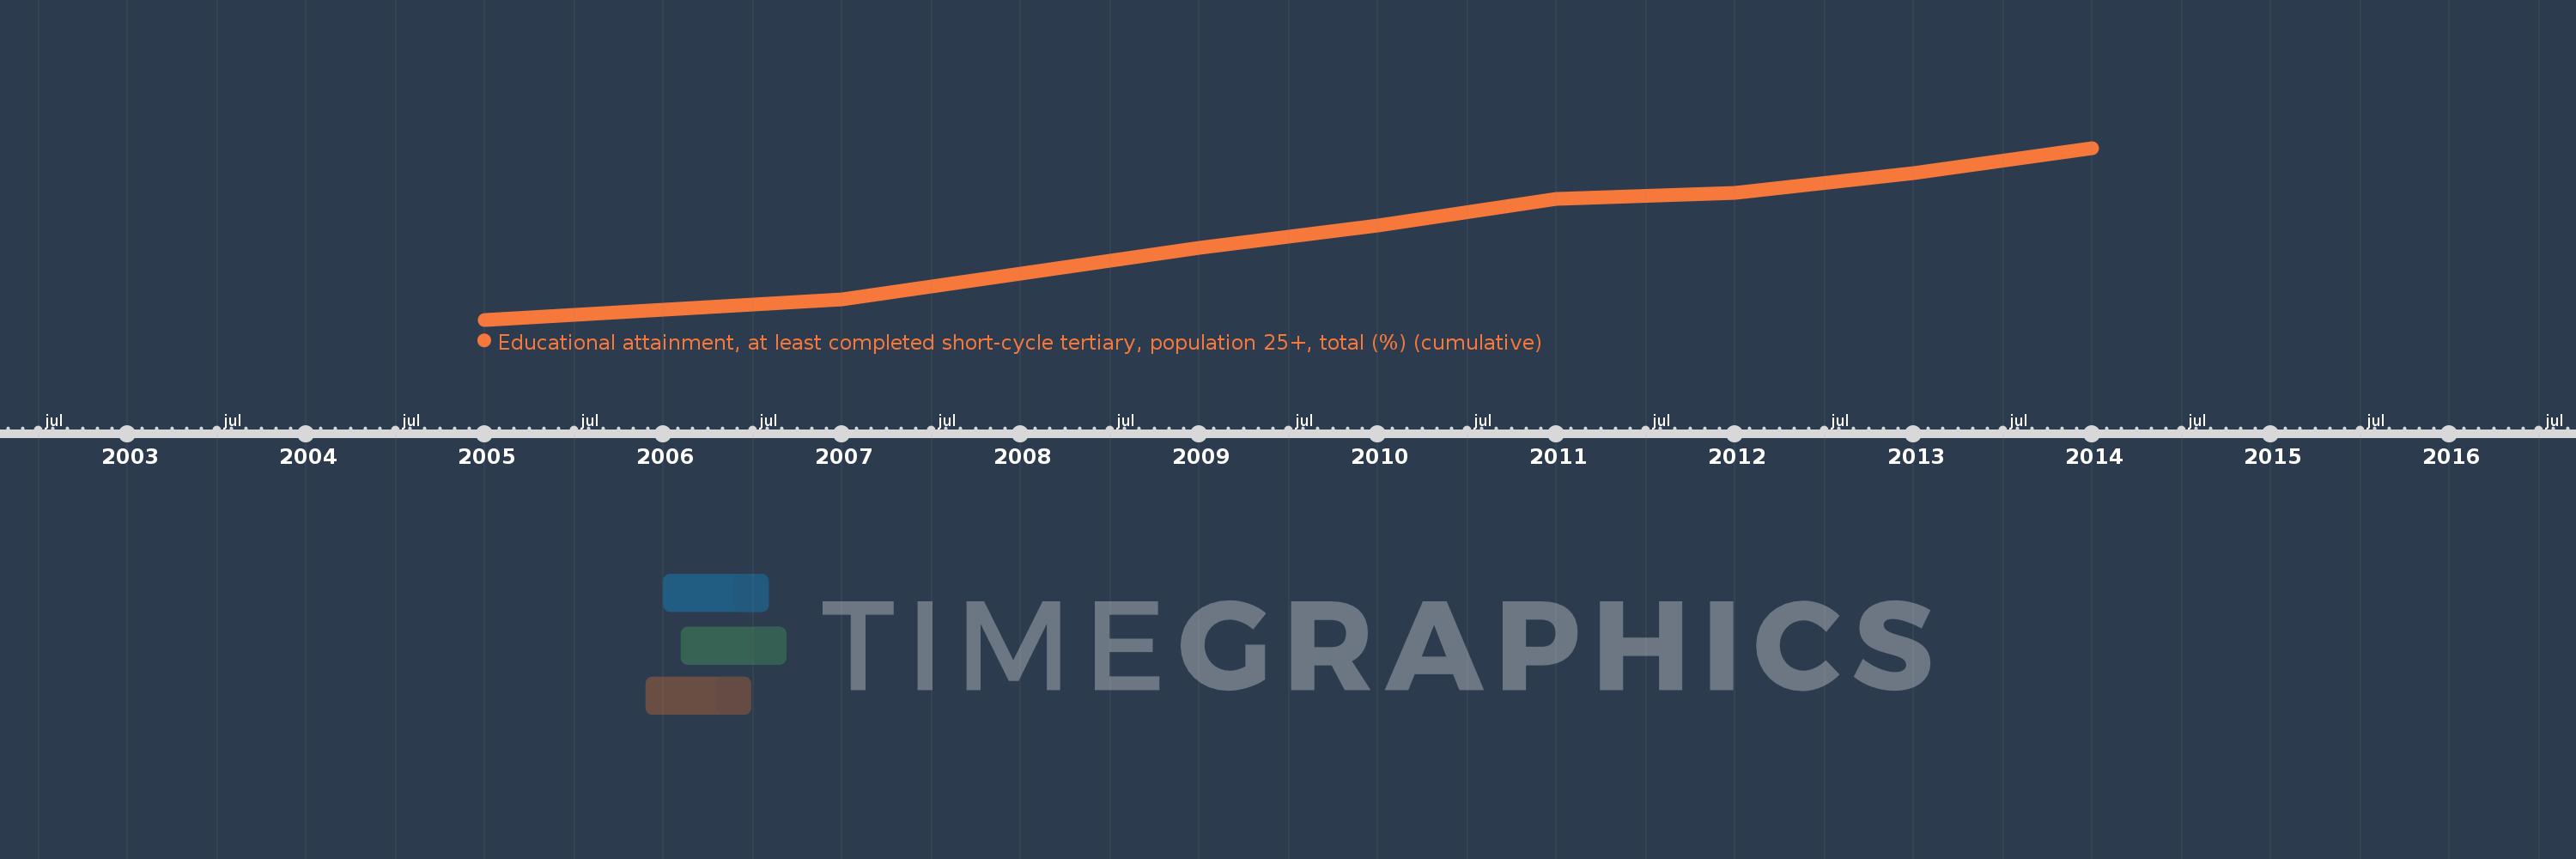
Questa scala temporale mostra un grafico dal 2005 anno al 2014 anno. Brazil. I dati fino ad 2004 anno non disponibili. Il numero di osservazioni attuali secondo i date: 9.
La fonte (nome):
Indicatori dello sviluppo mondiale
La fonte (organizzazione):
United Nations Educational, Scientific, and Cultural Organization (UNESCO) Institute for Statistics.
Categorie:
Education, Gender
sono stati aggiornati
23 apr 2017 anni
Indicatori delle variazioni dei valori per anni
In media:
10.449
Minima:
8.115
1 gen 2005 anni
Massimo:
12.632
1 gen 2014 anni
Alla data di osservazione
Valore
Variazione assoluta
La variazione rispetto al valore precedente
1 gen 2005 anni
8.115
+8.115
0.0%
1 gen 2007 anni
8.641
+0.526
6.48%
1 gen 2008 anni
9.333
+0.692
8.01%
1 gen 2009 anni
10.015
+0.682
7.31%
1 gen 2010 anni
10.597
+0.582
5.81%
1 gen 2011 anni
11.299
+0.703
6.63%
1 gen 2012 anni
11.45
+0.15
1.33%
1 gen 2013 anni
11.961
+0.512
4.47%
1 gen 2014 anni
12.632
+0.67
5.6%
Classificazione dei paesi secondo i statistiche attuali per anni