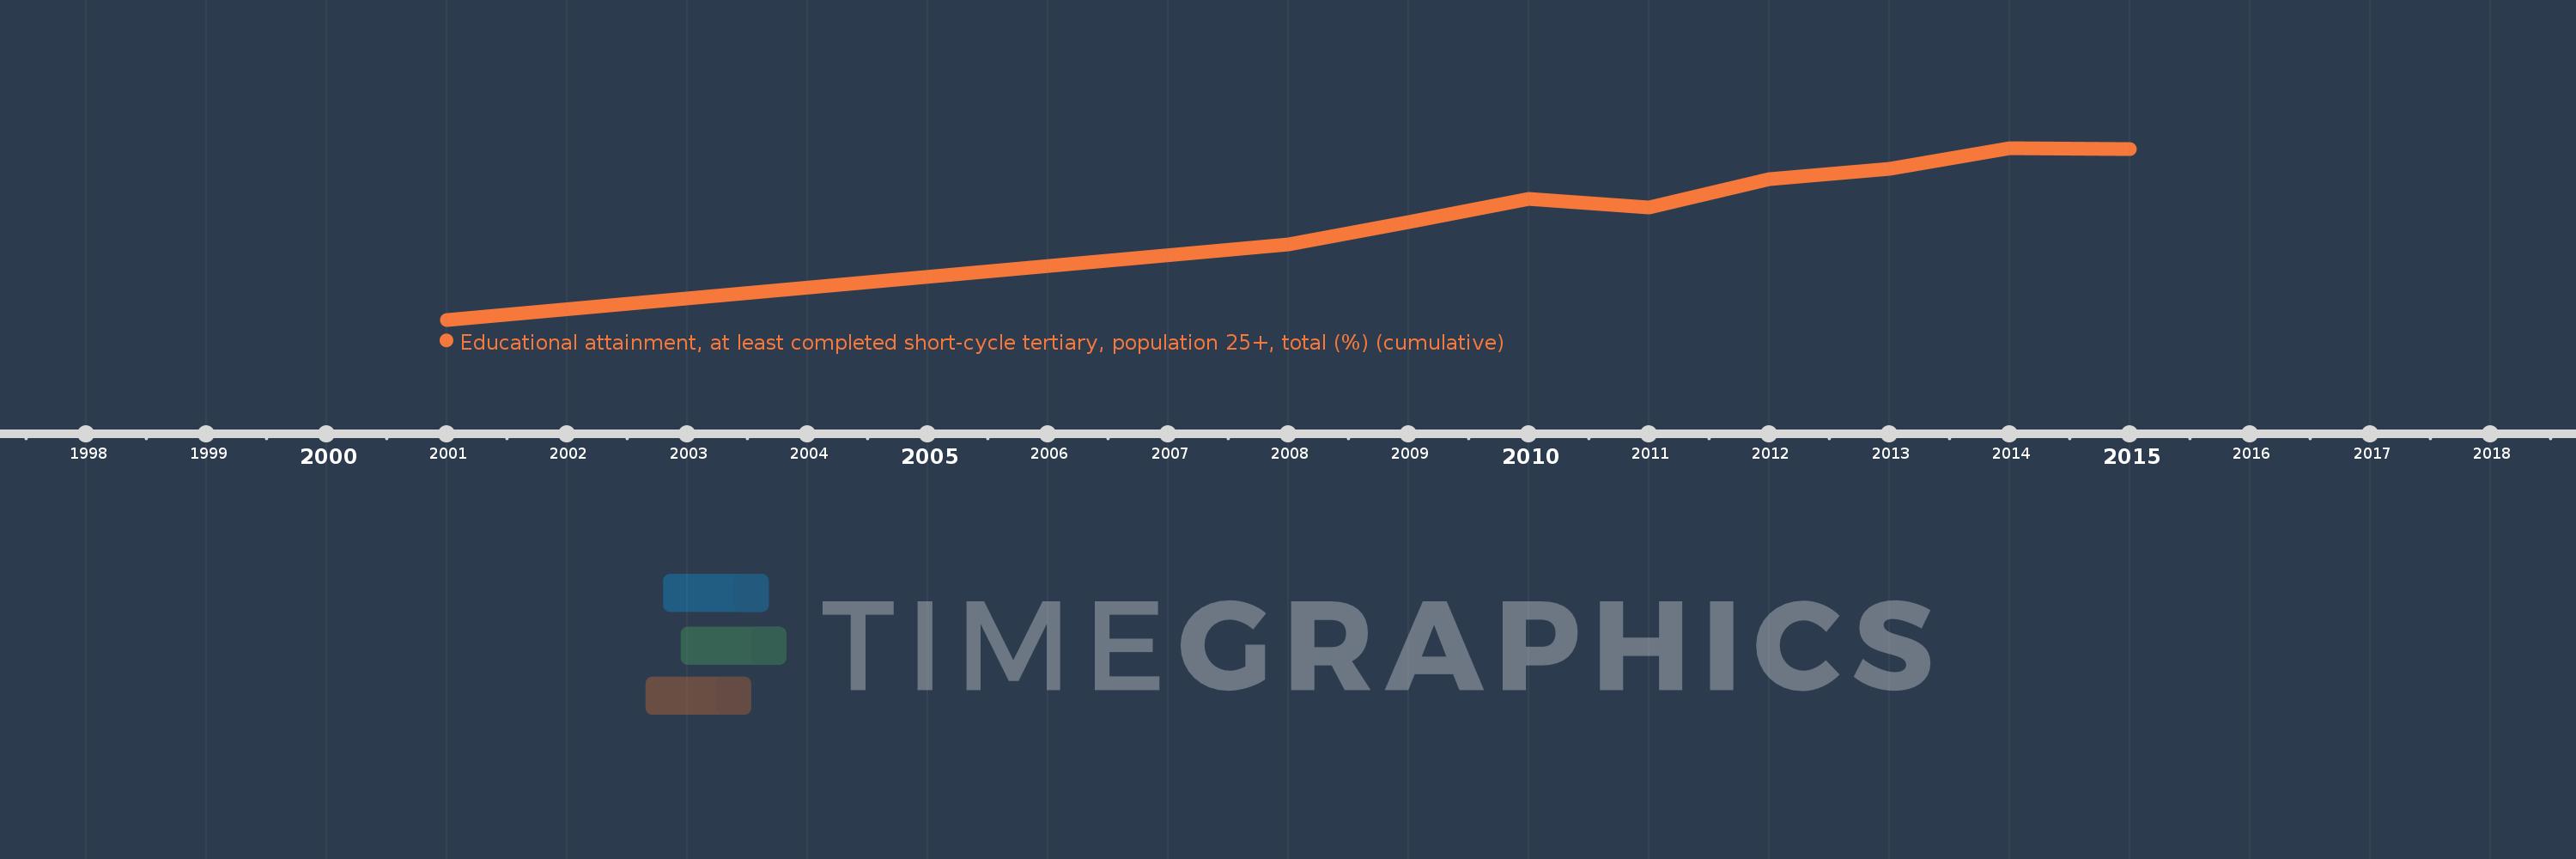
Questa scala temporale mostra un grafico dal 2001 anno al 2015 anno. Estonia. I dati fino ad 2000 anno non disponibili. Il numero di osservazioni attuali secondo i date: 9.
La fonte (nome):
Indicatori dello sviluppo mondiale
La fonte (organizzazione):
United Nations Educational, Scientific, and Cultural Organization (UNESCO) Institute for Statistics.
Categorie:
Education, Gender
sono stati aggiornati
23 apr 2017 anni
Indicatori delle variazioni dei valori per anni
In media:
34.21
Minima:
28.152
1 gen 2001 anni
Massimo:
37.16
1 gen 2014 anni
Alla data di osservazione
Valore
Variazione assoluta
La variazione rispetto al valore precedente
1 gen 2001 anni
28.152
+28.152
0.0%
1 gen 2008 anni
32.11
+3.957
14.06%
1 gen 2009 anni
33.254
+1.144
3.56%
1 gen 2010 anni
34.509
+1.255
3.77%
1 gen 2011 anni
34.029
-0.48
-1.39%
1 gen 2012 anni
35.53
+1.501
4.41%
1 gen 2013 anni
36.044
+0.514
1.45%
1 gen 2014 anni
37.16
+1.116
3.1%
1 gen 2015 anni
37.099
-0.062
-0.17%
Classificazione dei paesi secondo i statistiche attuali per anni