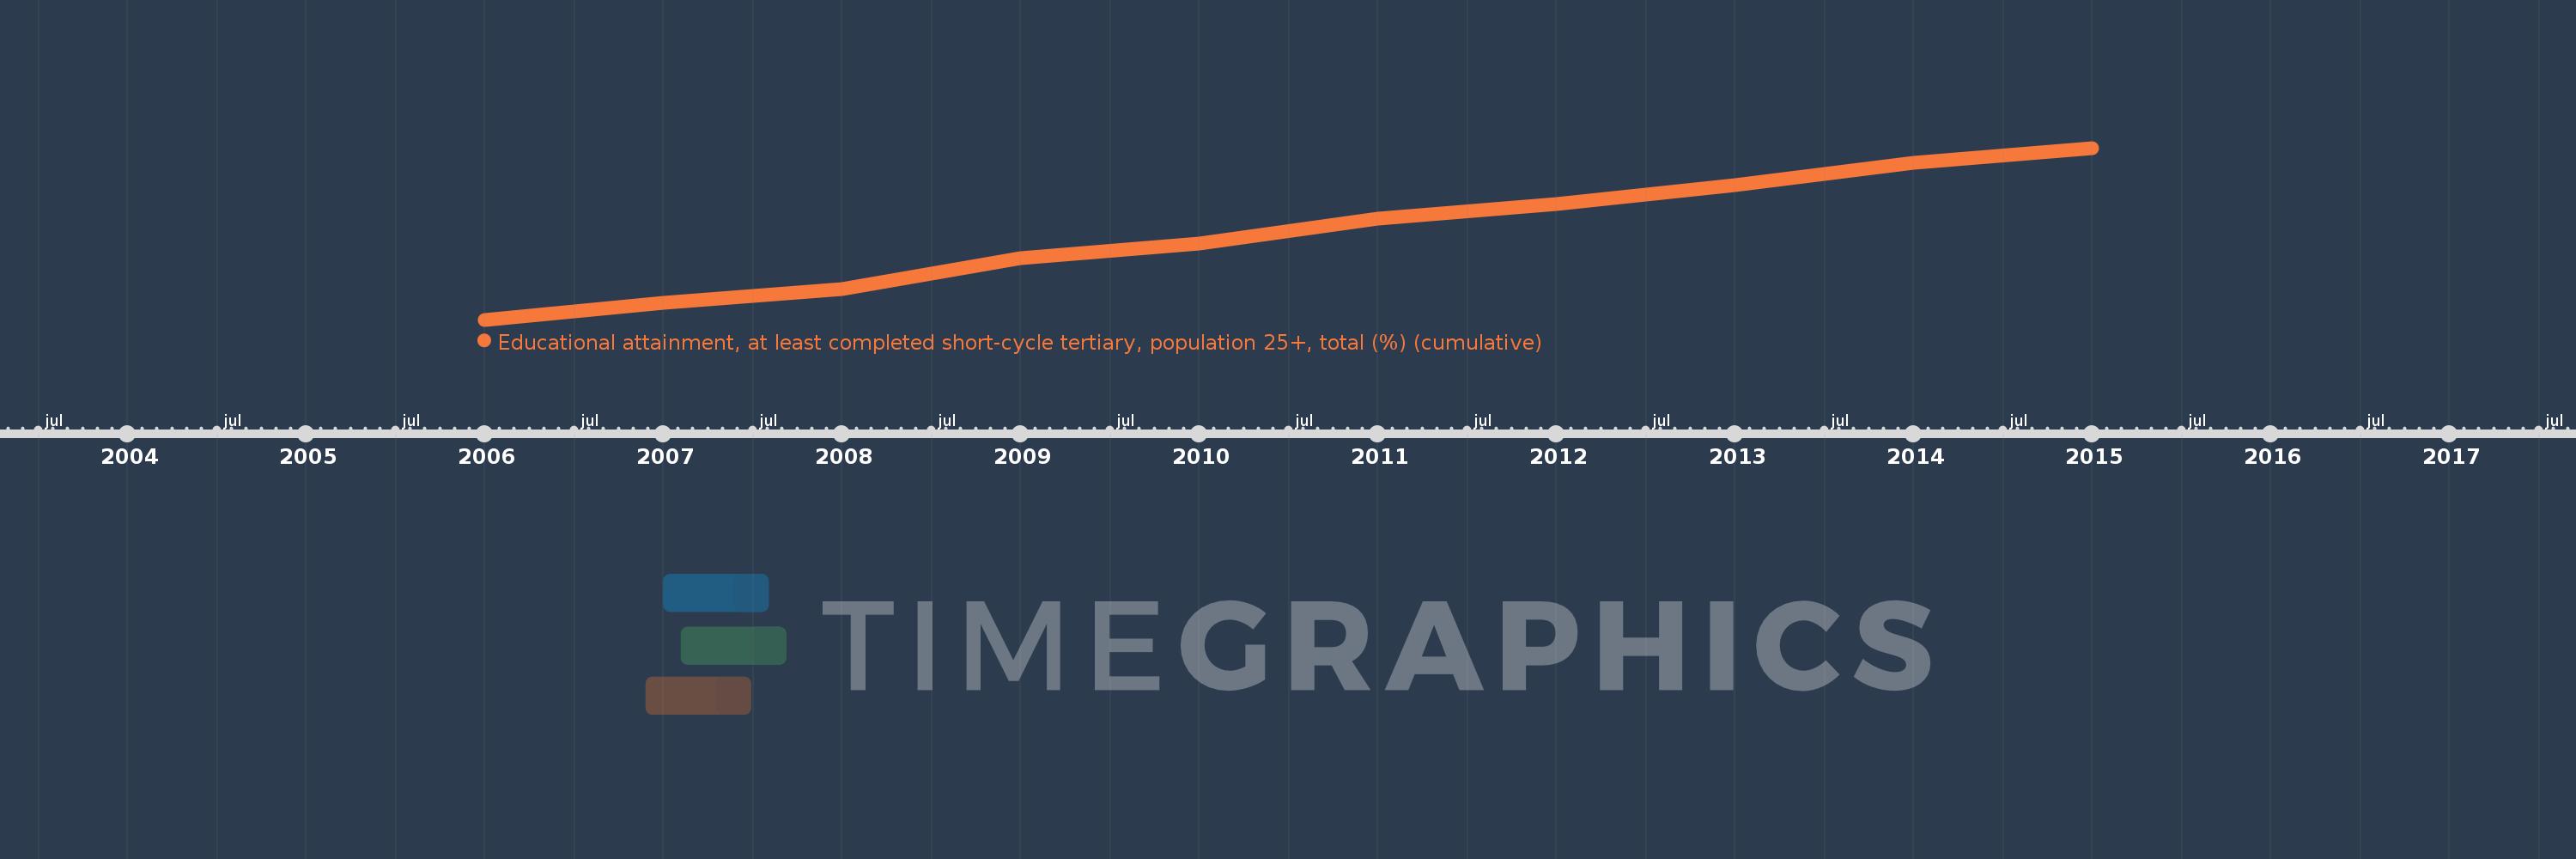
Questa scala temporale mostra un grafico dal 2006 anno al 2015 anno. Singapore. I dati fino ad 2005 anno non disponibili. Il numero di osservazioni attuali secondo i date: 10.
La fonte (nome):
Indicatori dello sviluppo mondiale
La fonte (organizzazione):
United Nations Educational, Scientific, and Cultural Organization (UNESCO) Institute for Statistics.
Categorie:
Education, Gender
sono stati aggiornati
23 apr 2017 anni
Indicatori delle variazioni dei valori per anni
In media:
35.83
Minima:
29.128
1 gen 2006 anni
Massimo:
42.441
1 gen 2015 anni
Alla data di osservazione
Valore
Variazione assoluta
La variazione rispetto al valore precedente
1 gen 2006 anni
29.128
+29.128
0.0%
1 gen 2007 anni
30.437
+1.309
4.49%
1 gen 2008 anni
31.473
+1.037
3.41%
1 gen 2009 anni
33.89
+2.417
7.68%
1 gen 2010 anni
35.019
+1.128
3.33%
1 gen 2011 anni
36.972
+1.953
5.58%
1 gen 2012 anni
38.081
+1.108
3.0%
1 gen 2013 anni
39.567
+1.487
3.9%
1 gen 2014 anni
41.29
+1.722
4.35%
1 gen 2015 anni
42.441
+1.151
2.79%
Classificazione dei paesi secondo i statistiche attuali per anni