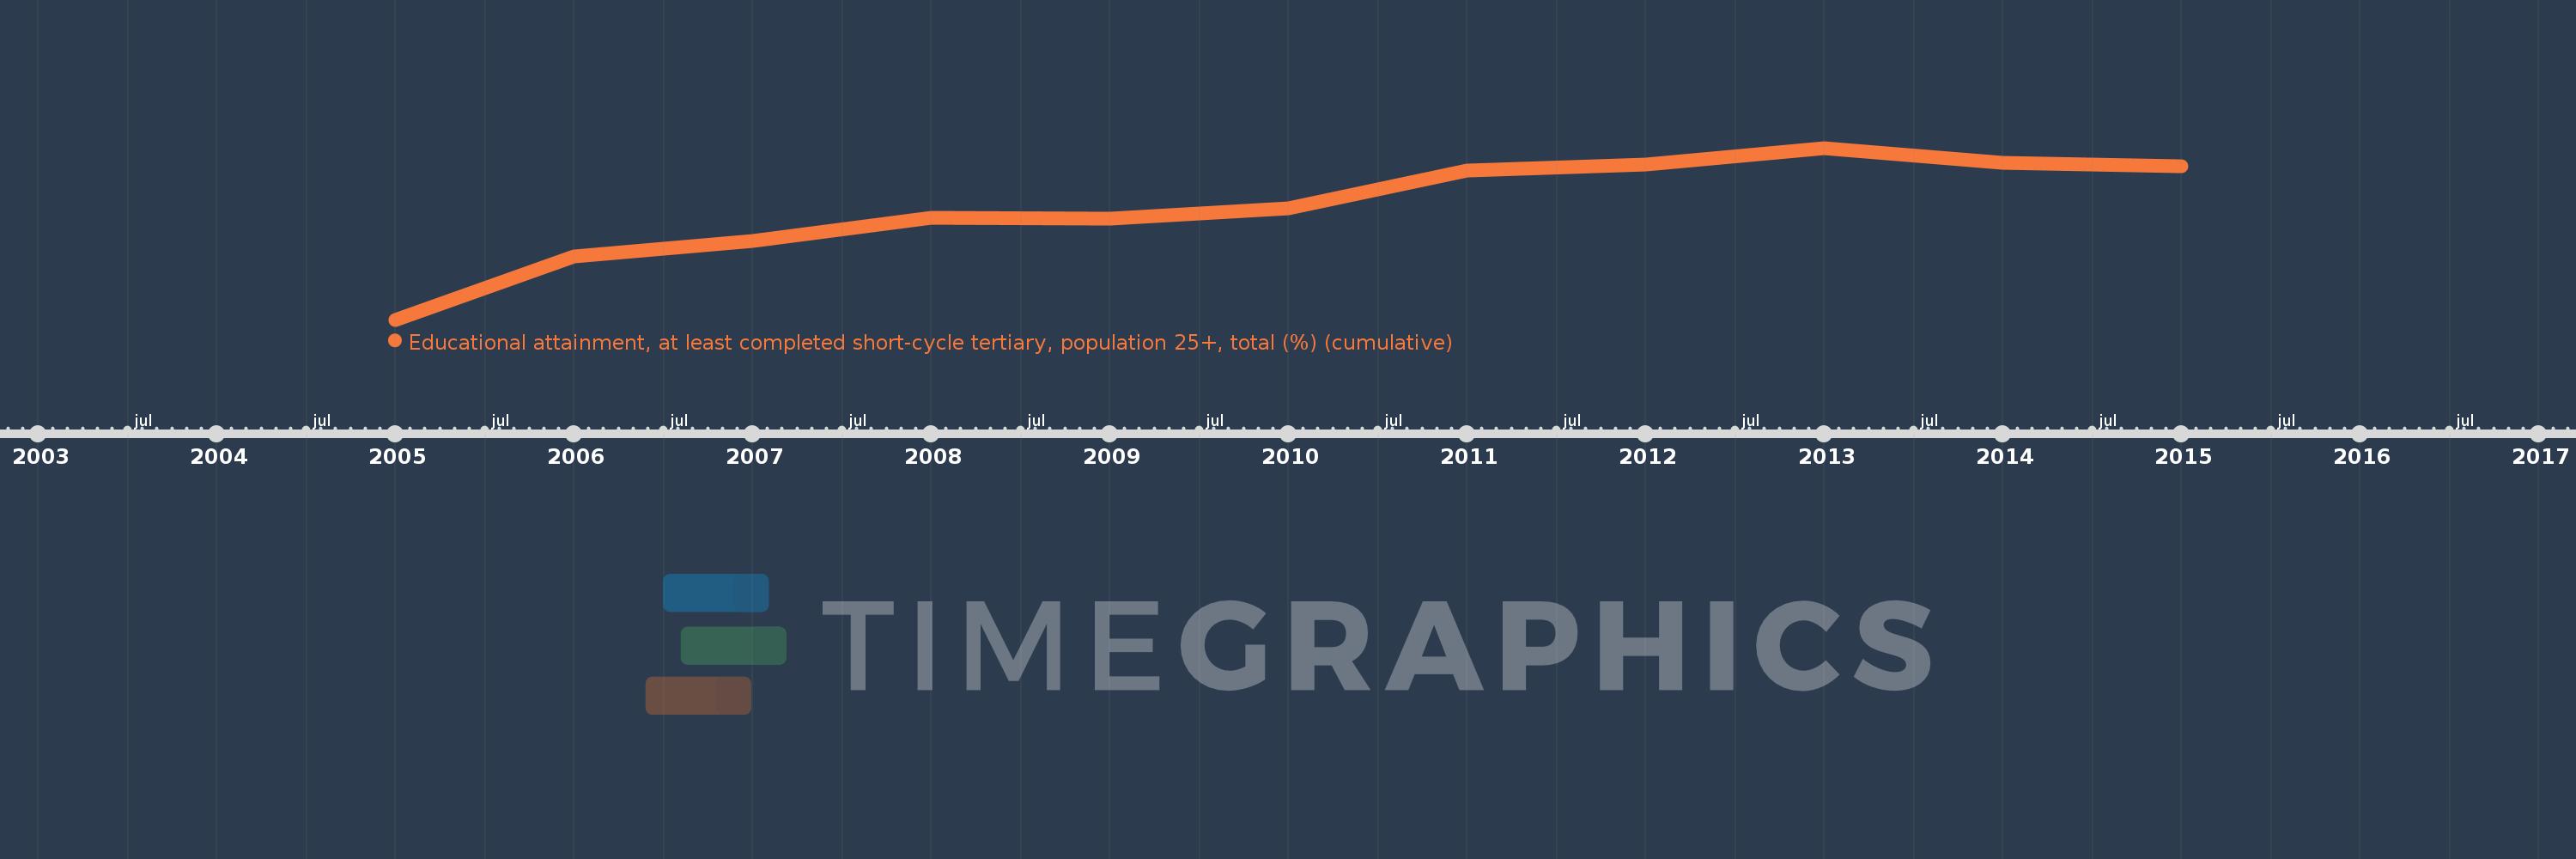
Questa scala temporale mostra un grafico dal 2005 anno al 2015 anno. Peru. I dati fino ad 2004 anno non disponibili. Il numero di osservazioni attuali secondo i date: 11.
La fonte (nome):
Indicatori dello sviluppo mondiale
La fonte (organizzazione):
United Nations Educational, Scientific, and Cultural Organization (UNESCO) Institute for Statistics.
Categorie:
Education, Gender
sono stati aggiornati
23 apr 2017 anni
Indicatori delle variazioni dei valori per anni
In media:
18.857
Minima:
12.513
1 gen 2005 anni
Massimo:
22.155
1 gen 2013 anni
Alla data di osservazione
Valore
Variazione assoluta
La variazione rispetto al valore precedente
1 gen 2005 anni
12.513
+12.513
0.0%
1 gen 2006 anni
16.06
+3.547
28.34%
1 gen 2007 anni
16.943
+0.883
5.5%
1 gen 2008 anni
18.217
+1.273
7.52%
1 gen 2009 anni
18.21
-0.007
-0.04%
1 gen 2010 anni
18.753
+0.543
2.98%
1 gen 2011 anni
20.874
+2.121
11.31%
1 gen 2012 anni
21.245
+0.371
1.78%
1 gen 2013 anni
22.155
+0.91
4.28%
1 gen 2014 anni
21.34
-0.815
-3.68%
1 gen 2015 anni
21.118
-0.221
-1.04%
Classificazione dei paesi secondo i statistiche attuali per anni