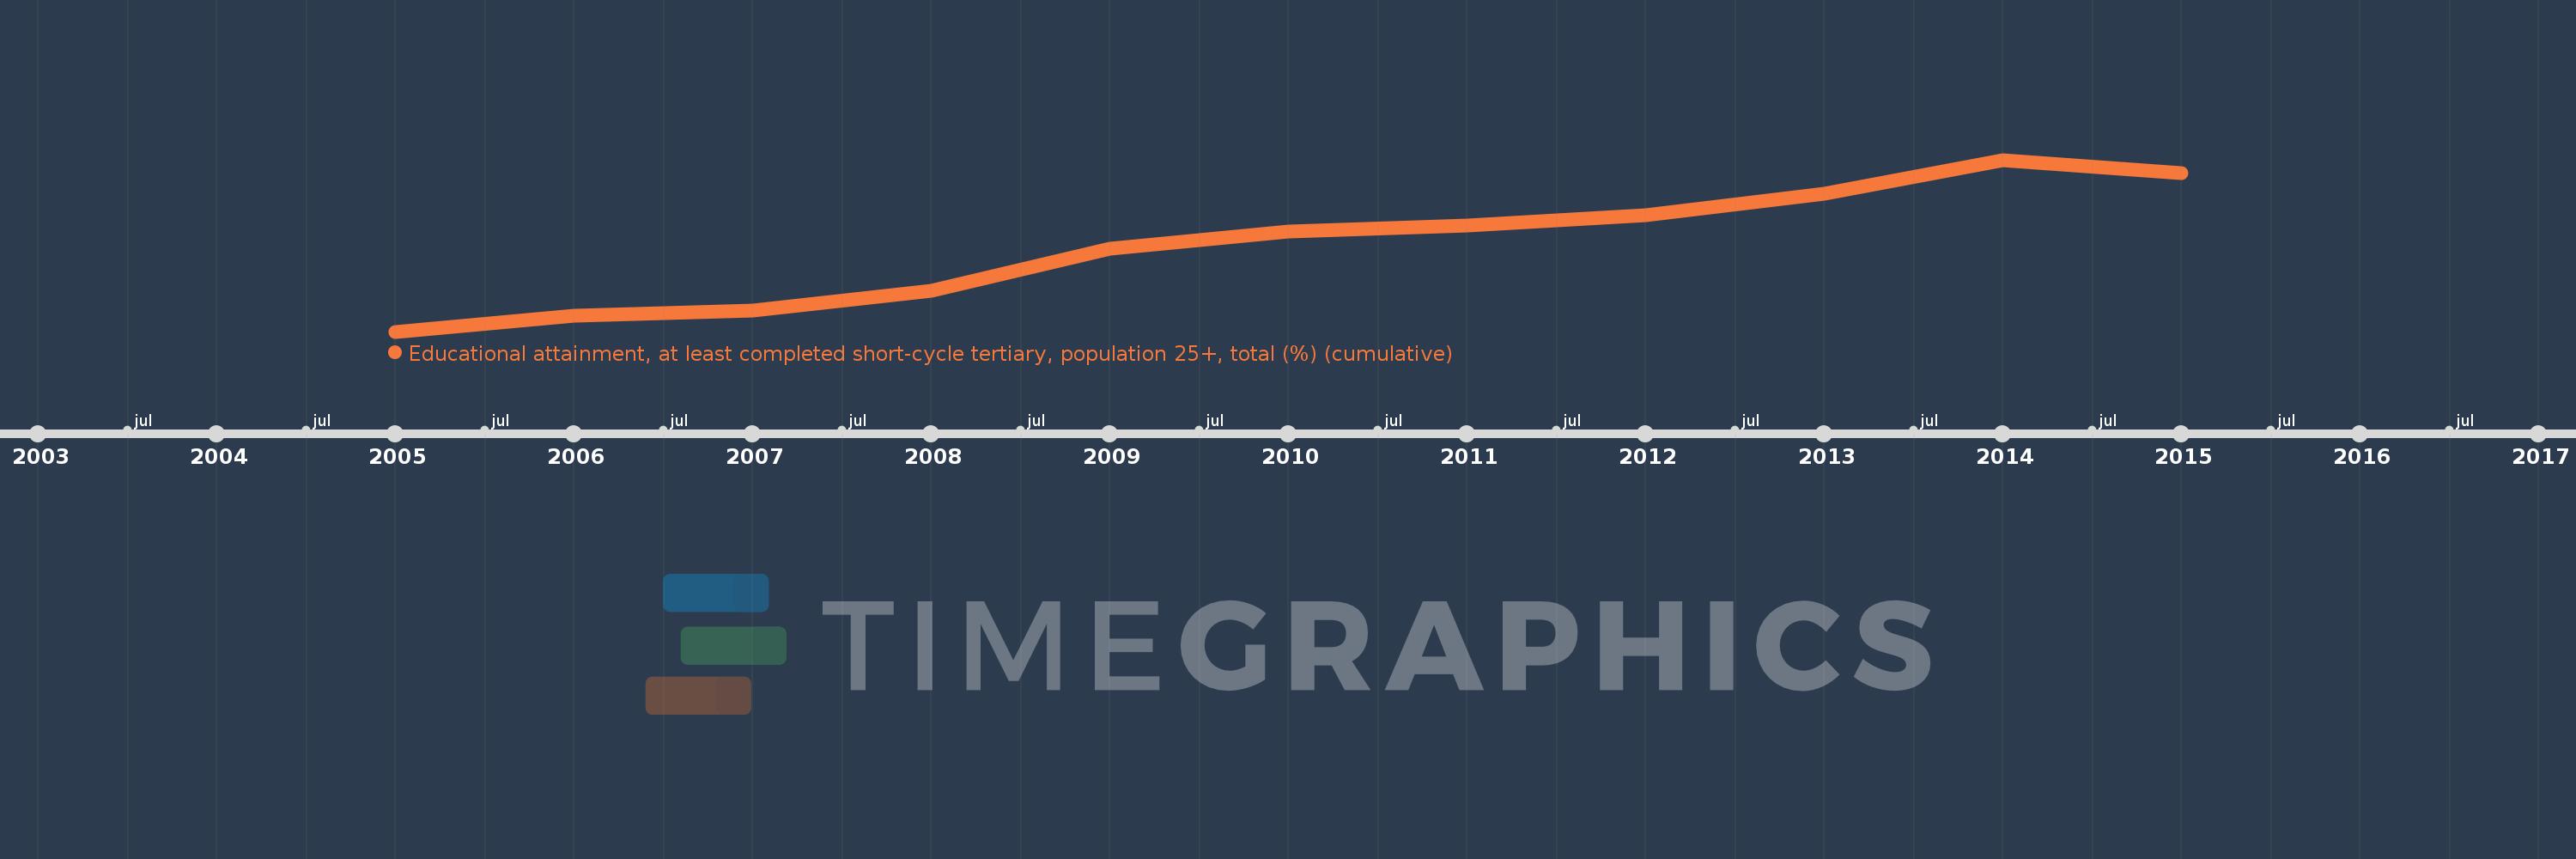
Questa scala temporale mostra un grafico dal 2005 anno al 2015 anno. Latvia. I dati fino ad 2004 anno non disponibili. Il numero di osservazioni attuali secondo i date: 11.
La fonte (nome):
Indicatori dello sviluppo mondiale
La fonte (organizzazione):
United Nations Educational, Scientific, and Cultural Organization (UNESCO) Institute for Statistics.
Categorie:
Education, Gender
sono stati aggiornati
23 apr 2017 anni
Indicatori delle variazioni dei valori per anni
In media:
24.181
Minima:
18.942
1 gen 2005 anni
Massimo:
29.342
1 gen 2014 anni
Alla data di osservazione
Valore
Variazione assoluta
La variazione rispetto al valore precedente
1 gen 2005 anni
18.942
+18.942
0.0%
1 gen 2006 anni
19.881
+0.938
4.95%
1 gen 2007 anni
20.228
+0.347
1.75%
1 gen 2008 anni
21.436
+1.208
5.97%
1 gen 2009 anni
23.96
+2.525
11.78%
1 gen 2010 anni
25.002
+1.041
4.35%
1 gen 2011 anni
25.354
+0.352
1.41%
1 gen 2012 anni
26.0
+0.646
2.55%
1 gen 2013 anni
27.291
+1.291
4.96%
1 gen 2014 anni
29.342
+2.051
7.52%
1 gen 2015 anni
28.556
-0.786
-2.68%
Classificazione dei paesi secondo i statistiche attuali per anni