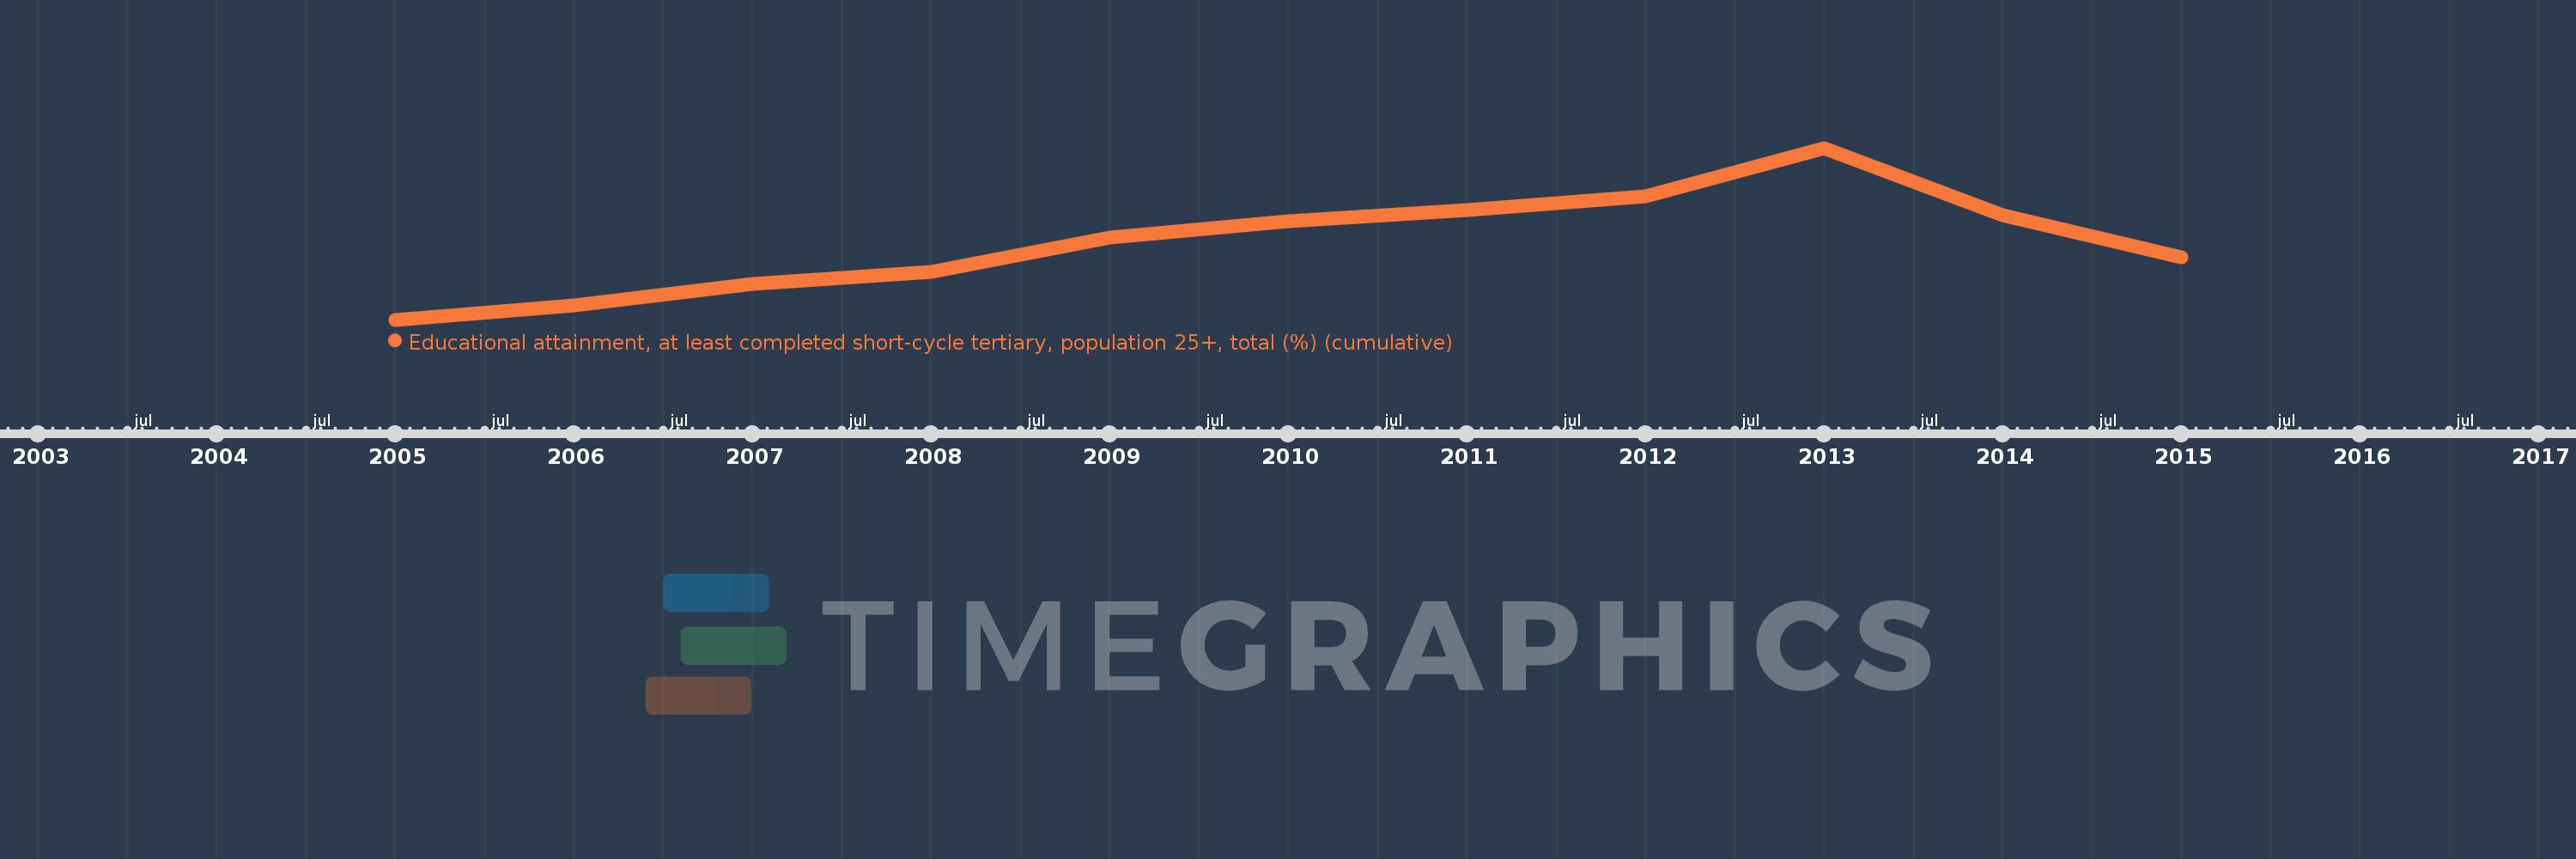
Questa scala temporale mostra un grafico dal 2005 anno al 2015 anno. Australia. I dati fino ad 2004 anno non disponibili. Il numero di osservazioni attuali secondo i date: 11.
La fonte (nome):
Indicatori dello sviluppo mondiale
La fonte (organizzazione):
United Nations Educational, Scientific, and Cultural Organization (UNESCO) Institute for Statistics.
Categorie:
Education, Gender
sono stati aggiornati
23 apr 2017 anni
Indicatori delle variazioni dei valori per anni
In media:
35.532
Minima:
30.823
1 gen 2005 anni
Massimo:
41.28
1 gen 2013 anni
Alla data di osservazione
Valore
Variazione assoluta
La variazione rispetto al valore precedente
1 gen 2005 anni
30.823
+30.823
0.0%
1 gen 2006 anni
31.691
+0.868
2.82%
1 gen 2007 anni
33.013
+1.322
4.17%
1 gen 2008 anni
33.741
+0.728
2.21%
1 gen 2009 anni
35.819
+2.078
6.16%
1 gen 2010 anni
36.803
+0.985
2.75%
1 gen 2011 anni
37.488
+0.685
1.86%
1 gen 2012 anni
38.359
+0.871
2.32%
1 gen 2013 anni
41.28
+2.921
7.61%
1 gen 2014 anni
37.206
-4.074
-9.87%
1 gen 2015 anni
34.632
-2.573
-6.92%
Classificazione dei paesi secondo i statistiche attuali per anni