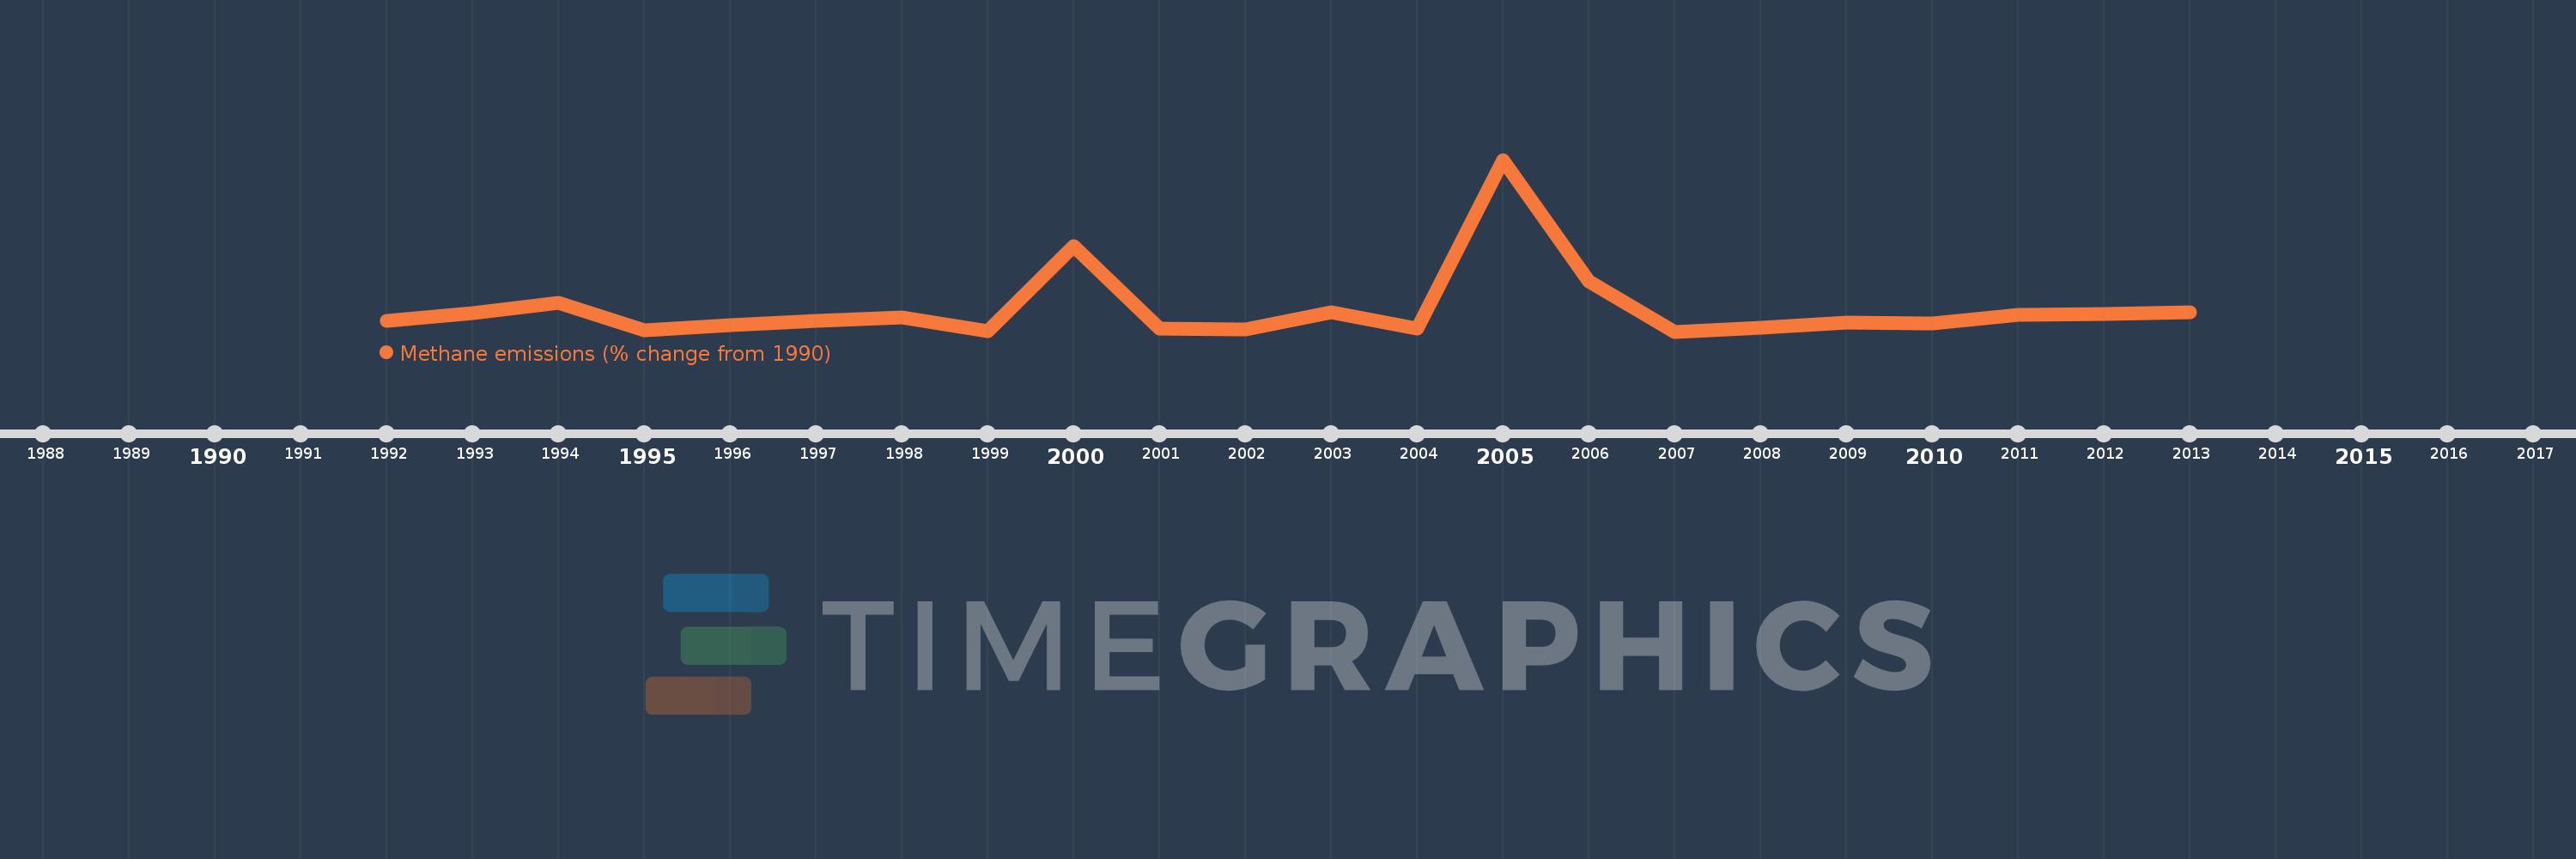
Questa scala temporale mostra un grafico dal 1992 anno al 2013 anno. Bolivia. I dati fino ad 1991 anno non disponibili. Il numero di osservazioni attuali secondo i date: 22.
La fonte (nome):
Indicatori dello sviluppo mondiale
La fonte (organizzazione):
World Bank staff estimates from original source: European Commission, Joint Research Centre (JRC)/Netherlands Environmental Assessment Agency (PBL). Emission Database for Global Atmospheric Research (EDGAR): http://edgar.jrc.ec.europa.eu/.
Categorie:
Climate Change, Environment
sono stati aggiornati
23 apr 2017 anni
Indicatori delle variazioni dei valori per anni
In media:
7.037
Minima:
-14.508
1 gen 2007 anni
Massimo:
148.988
1 gen 2005 anni
Alla data di osservazione
Valore
Variazione assoluta
La variazione rispetto al valore precedente
1 gen 1992 anni
-4.603
-4.603
0.0%
1 gen 1993 anni
2.792
+7.394
-160.65%
1 gen 1994 anni
12.628
+9.836
352.37%
1 gen 1995 anni
-13.36
-25.988
-205.8%
1 gen 1996 anni
-8.4
+4.96
-37.12%
1 gen 1997 anni
-4.191
+4.209
-50.11%
1 gen 1998 anni
-1.244
+2.948
-70.33%
1 gen 1999 anni
-14.445
-13.202
1.06 Mille.%
1 gen 2000 anni
66.95
+81.395
-563.48%
1 gen 2001 anni
-11.901
-78.852
-117.78%
1 gen 2002 anni
-12.788
-0.887
7.45%
1 gen 2003 anni
4.013
+16.801
-131.38%
1 gen 2004 anni
-11.932
-15.945
-397.35%
1 gen 2005 anni
148.988
+160.92
-1.35 Mille.%
1 gen 2006 anni
33.014
-115.974
-77.84%
1 gen 2007 anni
-14.508
-47.521
-143.94%
1 gen 2008 anni
-11.109
+3.399
-23.43%
1 gen 2009 anni
-6.328
+4.781
-43.04%
1 gen 2010 anni
-6.36
-0.032
0.51%
1 gen 2011 anni
1.515
+7.875
-123.83%
1 gen 2012 anni
2.531
+1.015
66.99%
1 gen 2013 anni
3.546
+1.015
40.12%
Classificazione dei paesi secondo i statistiche attuali per anni