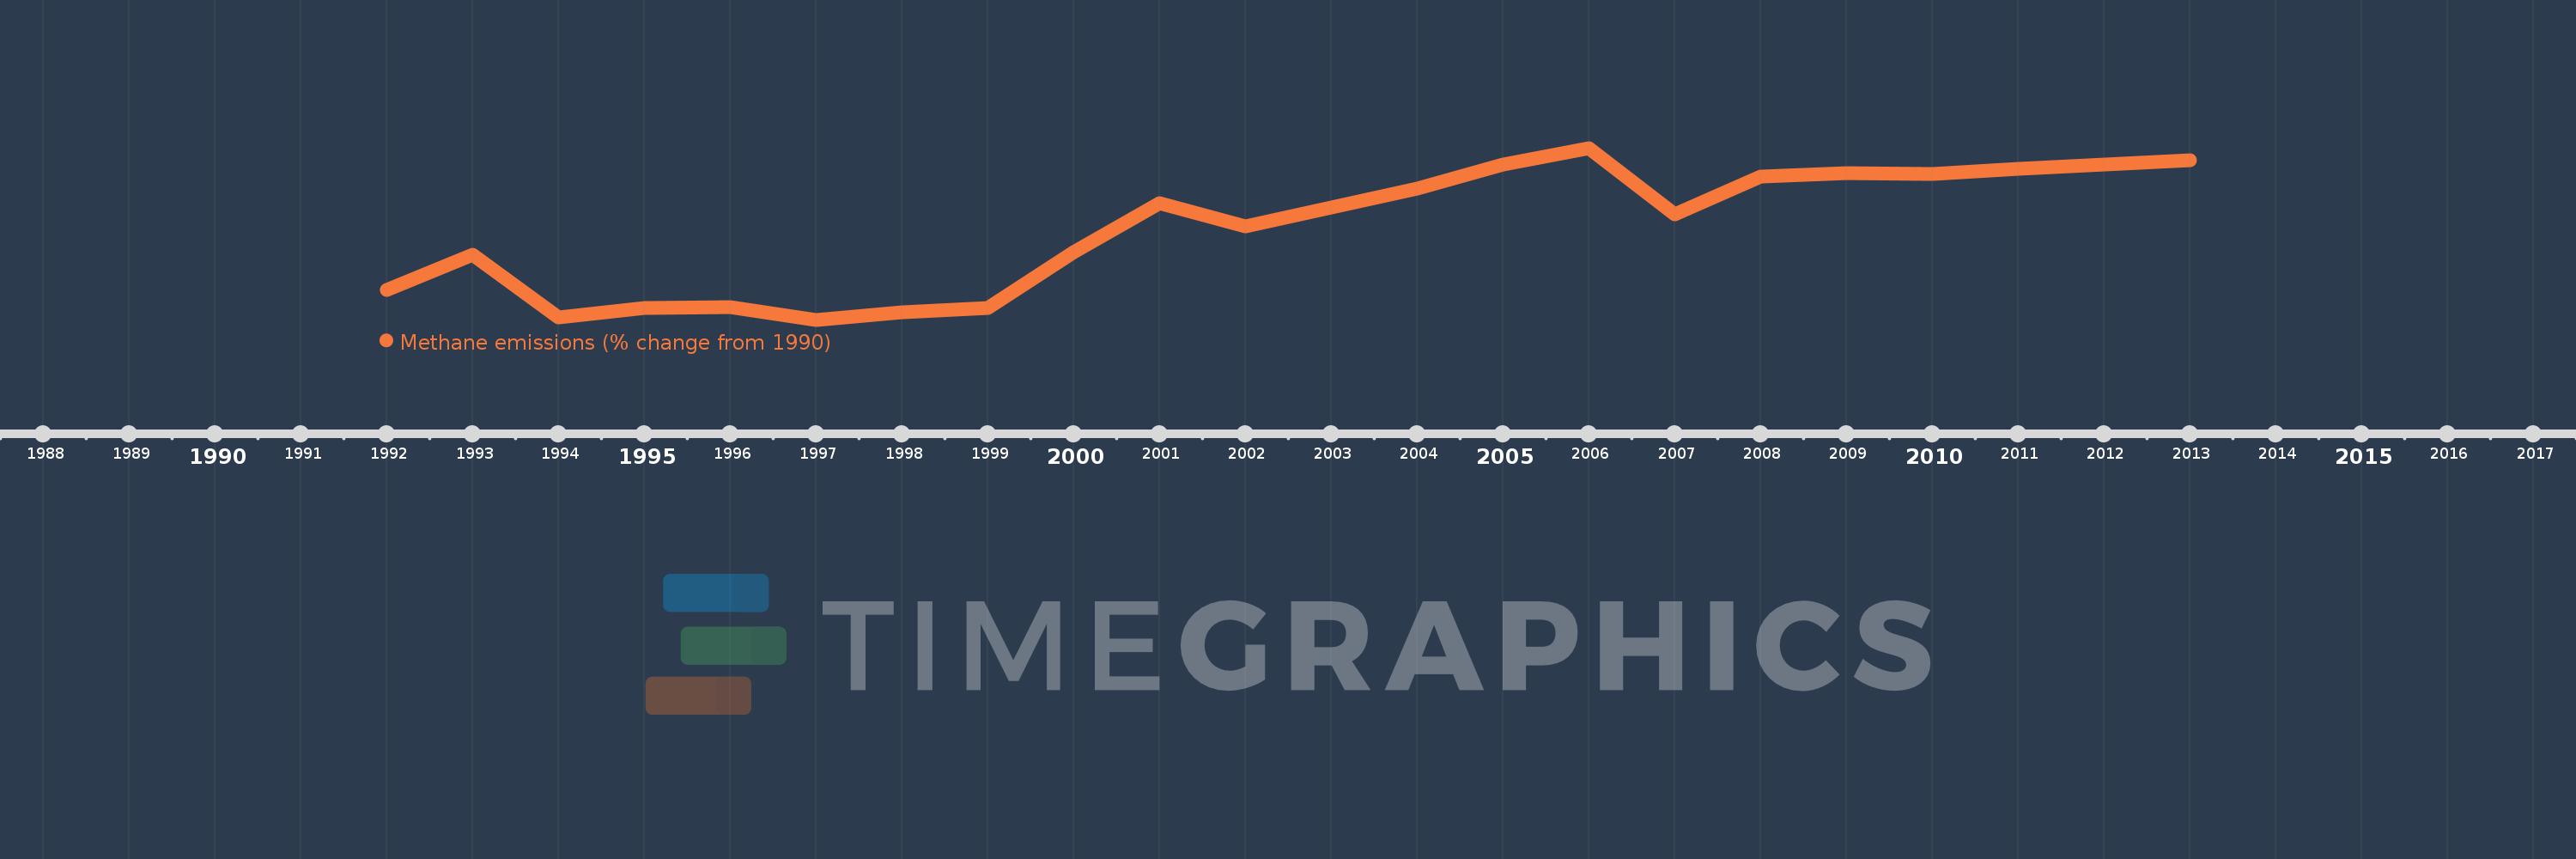
Questa scala temporale mostra un grafico dal 1992 anno al 2013 anno. Namibia. I dati fino ad 1991 anno non disponibili. Il numero di osservazioni attuali secondo i date: 22.
La fonte (nome):
Indicatori dello sviluppo mondiale
La fonte (organizzazione):
World Bank staff estimates from original source: European Commission, Joint Research Centre (JRC)/Netherlands Environmental Assessment Agency (PBL). Emission Database for Global Atmospheric Research (EDGAR): http://edgar.jrc.ec.europa.eu/.
Categorie:
Climate Change, Environment
sono stati aggiornati
23 apr 2017 anni
Indicatori delle variazioni dei valori per anni
In media:
19.939
Minima:
-11.214
1 gen 1997 anni
Massimo:
47.779
1 gen 2006 anni
Alla data di osservazione
Valore
Variazione assoluta
La variazione rispetto al valore precedente
1 gen 1992 anni
-1.051
-1.051
0.0%
1 gen 1993 anni
11.258
+12.31
-1.17 Mille.%
1 gen 1994 anni
-10.421
-21.679
-192.56%
1 gen 1995 anni
-7.162
+3.259
-31.28%
1 gen 1996 anni
-6.854
+0.308
-4.29%
1 gen 1997 anni
-11.214
-4.36
63.61%
1 gen 1998 anni
-8.747
+2.467
-22.0%
1 gen 1999 anni
-7.215
+1.531
-17.51%
1 gen 2000 anni
12.073
+19.288
-267.33%
1 gen 2001 anni
28.935
+16.862
139.66%
1 gen 2002 anni
20.917
-8.018
-27.71%
1 gen 2003 anni
27.257
+6.341
30.32%
1 gen 2004 anni
33.788
+6.531
23.96%
1 gen 2005 anni
42.148
+8.36
24.74%
1 gen 2006 anni
47.779
+5.631
13.36%
1 gen 2007 anni
24.977
-22.802
-47.72%
1 gen 2008 anni
38.095
+13.118
52.52%
1 gen 2009 anni
39.075
+0.98
2.57%
1 gen 2010 anni
38.89
-0.185
-0.47%
1 gen 2011 anni
40.639
+1.749
4.5%
1 gen 2012 anni
42.045
+1.406
3.46%
1 gen 2013 anni
43.452
+1.406
3.34%
Classificazione dei paesi secondo i statistiche attuali per anni