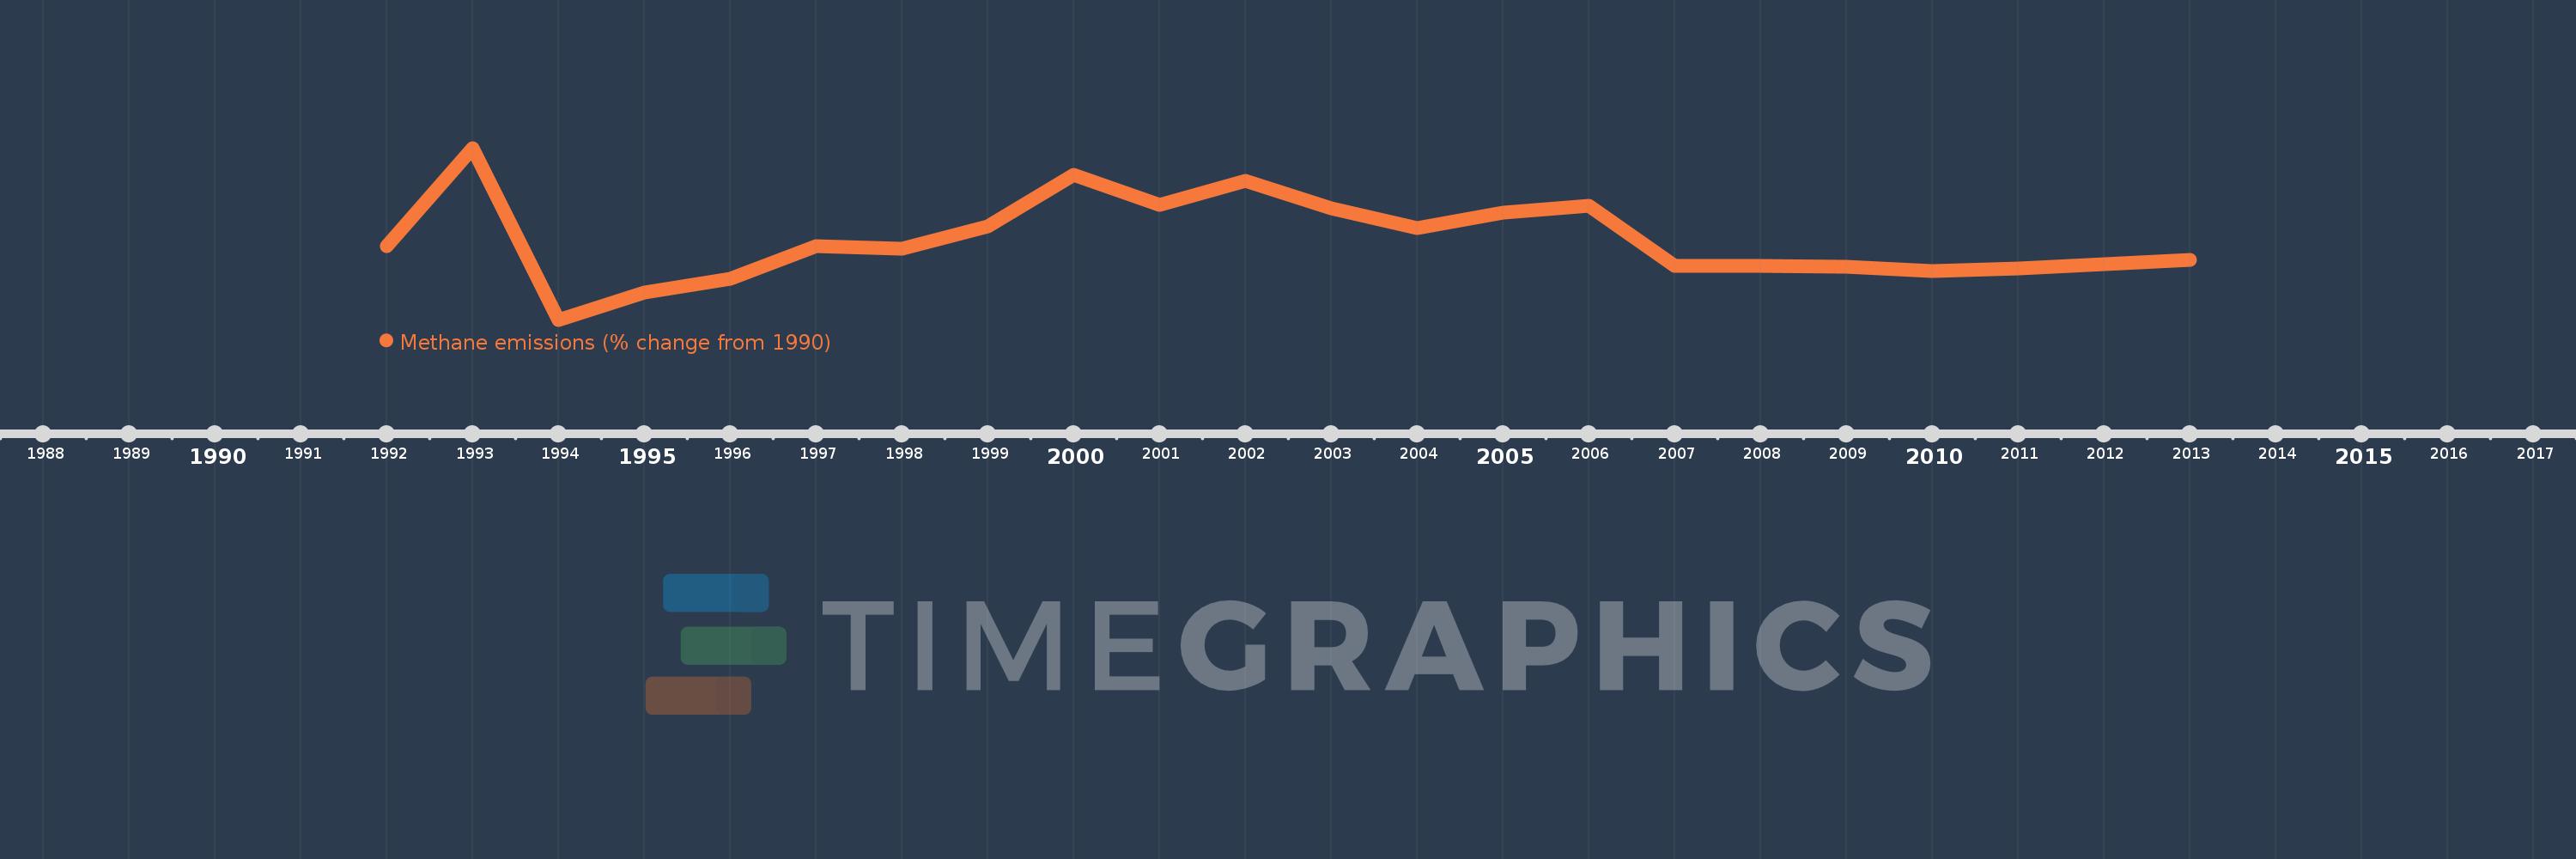
Questa scala temporale mostra un grafico dal 1992 anno al 2013 anno. Zimbabwe. I dati fino ad 1991 anno non disponibili. Il numero di osservazioni attuali secondo i date: 22.
La fonte (nome):
Indicatori dello sviluppo mondiale
La fonte (organizzazione):
World Bank staff estimates from original source: European Commission, Joint Research Centre (JRC)/Netherlands Environmental Assessment Agency (PBL). Emission Database for Global Atmospheric Research (EDGAR): http://edgar.jrc.ec.europa.eu/.
Categorie:
Climate Change, Environment
sono stati aggiornati
23 apr 2017 anni
Indicatori delle variazioni dei valori per anni
In media:
-12.477
Minima:
-27.702
1 gen 1994 anni
Massimo:
5.161
1 gen 1993 anni
Alla data di osservazione
Valore
Variazione assoluta
La variazione rispetto al valore precedente
1 gen 1992 anni
-13.685
-13.685
0.0%
1 gen 1993 anni
5.161
+18.846
-137.71%
1 gen 1994 anni
-27.702
-32.863
-636.77%
1 gen 1995 anni
-22.428
+5.274
-19.04%
1 gen 1996 anni
-19.855
+2.573
-11.47%
1 gen 1997 anni
-13.588
+6.267
-31.57%
1 gen 1998 anni
-14.038
-0.451
3.32%
1 gen 1999 anni
-9.89
+4.149
-29.55%
1 gen 2000 anni
-0.058
+9.832
-99.42%
1 gen 2001 anni
-5.699
-5.641
9.81 Mille.%
1 gen 2002 anni
-1.155
+4.543
-79.73%
1 gen 2003 anni
-6.359
-5.203
450.35%
1 gen 2004 anni
-10.211
-3.852
60.57%
1 gen 2005 anni
-7.154
+3.057
-29.94%
1 gen 2006 anni
-5.832
+1.322
-18.47%
1 gen 2007 anni
-17.467
-11.635
199.51%
1 gen 2008 anni
-17.435
+0.033
-0.19%
1 gen 2009 anni
-17.561
-0.127
0.73%
1 gen 2010 anni
-18.318
-0.757
4.31%
1 gen 2011 anni
-17.898
+0.42
-2.29%
1 gen 2012 anni
-17.077
+0.821
-4.59%
1 gen 2013 anni
-16.256
+0.821
-4.81%
Classificazione dei paesi secondo i statistiche attuali per anni