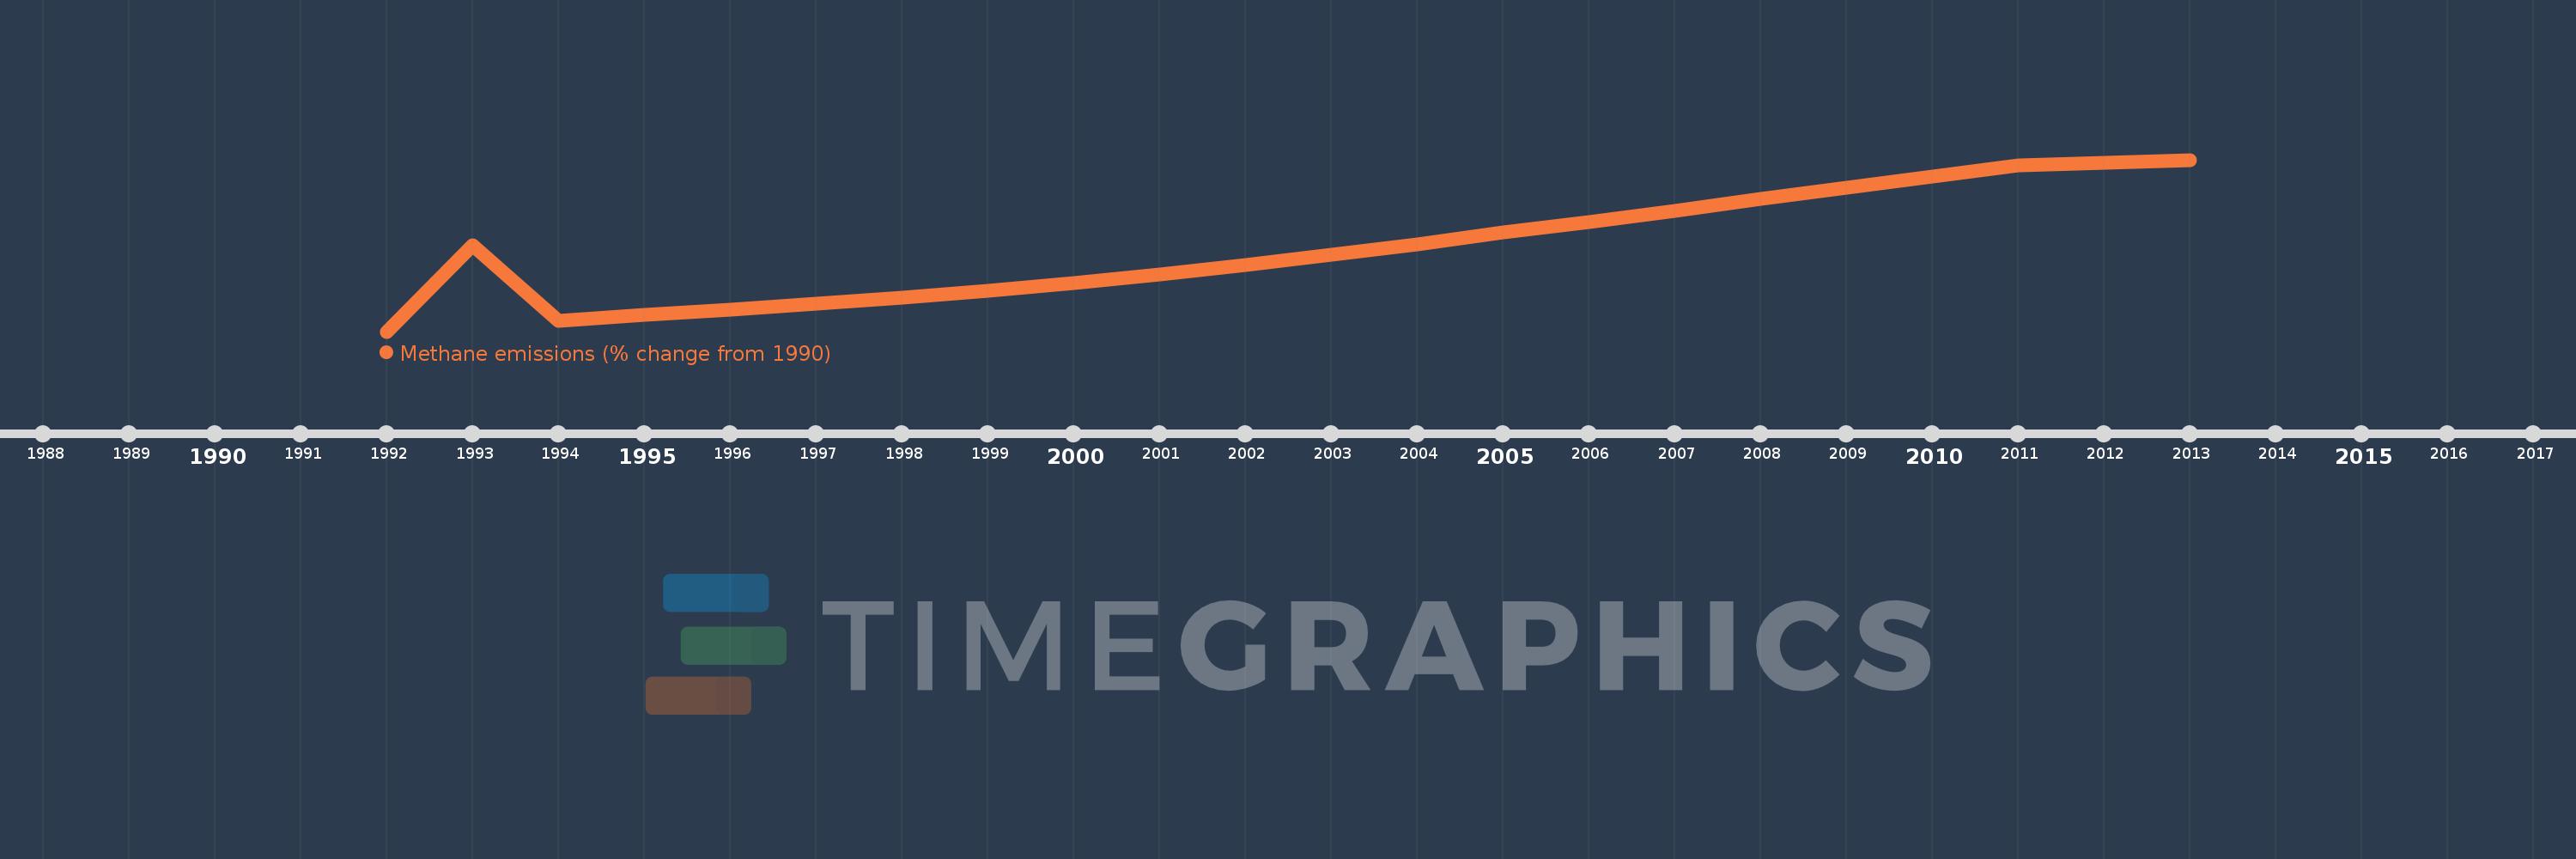
Questa scala temporale mostra un grafico dal 1992 anno al 2013 anno. Turks and Caicos Islands. I dati fino ad 1991 anno non disponibili. Il numero di osservazioni attuali secondo i date: 22.
La fonte (nome):
Indicatori dello sviluppo mondiale
La fonte (organizzazione):
World Bank staff estimates from original source: European Commission, Joint Research Centre (JRC)/Netherlands Environmental Assessment Agency (PBL). Emission Database for Global Atmospheric Research (EDGAR): http://edgar.jrc.ec.europa.eu/.
Categorie:
Climate Change, Environment
sono stati aggiornati
23 apr 2017 anni
Indicatori delle variazioni dei valori per anni
In media:
82.843
Minima:
3.931
1 gen 1992 anni
Massimo:
165.785
1 gen 2013 anni
Alla data di osservazione
Valore
Variazione assoluta
La variazione rispetto al valore precedente
1 gen 1992 anni
3.931
+3.931
0.0%
1 gen 1993 anni
85.199
+81.268
2.07 Mille.%
1 gen 1994 anni
14.122
-71.077
-83.42%
1 gen 1995 anni
19.619
+5.497
38.93%
1 gen 1996 anni
24.88
+5.261
26.81%
1 gen 1997 anni
30.455
+5.575
22.41%
1 gen 1998 anni
36.004
+5.55
18.22%
1 gen 1999 anni
42.583
+6.579
18.27%
1 gen 2000 anni
49.481
+6.897
16.2%
1 gen 2001 anni
57.44
+7.959
16.09%
1 gen 2002 anni
66.51
+9.07
15.79%
1 gen 2003 anni
76.124
+9.614
14.45%
1 gen 2004 anni
86.459
+10.335
13.58%
1 gen 2005 anni
97.044
+10.585
12.24%
1 gen 2006 anni
107.062
+10.018
10.32%
1 gen 2007 anni
117.848
+10.786
10.07%
1 gen 2008 anni
128.883
+11.035
9.36%
1 gen 2009 anni
139.433
+10.55
8.19%
1 gen 2010 anni
149.936
+10.503
7.53%
1 gen 2011 anni
160.574
+10.638
7.09%
1 gen 2012 anni
163.179
+2.606
1.62%
1 gen 2013 anni
165.785
+2.606
1.6%
Classificazione dei paesi secondo i statistiche attuali per anni