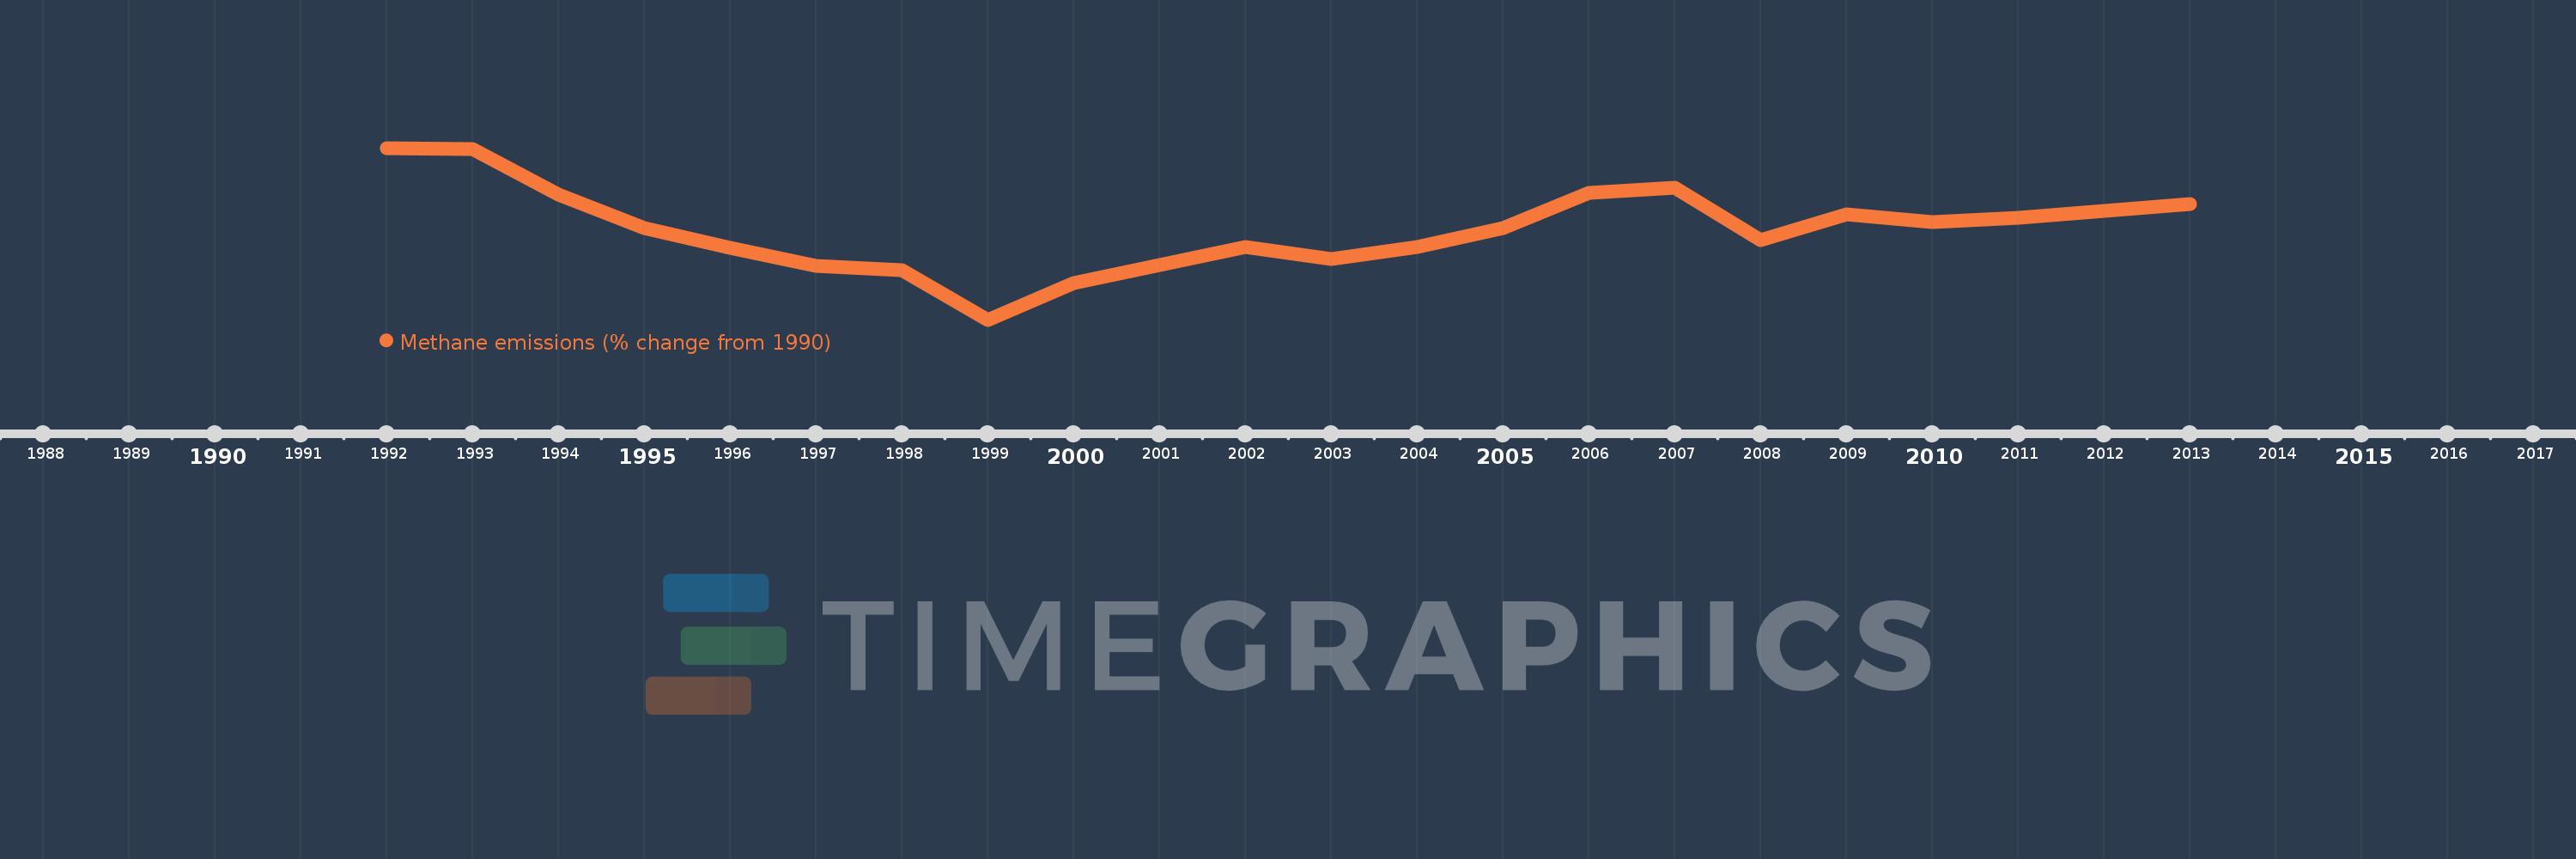
Questa scala temporale mostra un grafico dal 1992 anno al 2013 anno. Korea, Dem. People’s Rep.. I dati fino ad 1991 anno non disponibili. Il numero di osservazioni attuali secondo i date: 22.
La fonte (nome):
Indicatori dello sviluppo mondiale
La fonte (organizzazione):
World Bank staff estimates from original source: European Commission, Joint Research Centre (JRC)/Netherlands Environmental Assessment Agency (PBL). Emission Database for Global Atmospheric Research (EDGAR): http://edgar.jrc.ec.europa.eu/.
Categorie:
Climate Change, Environment
sono stati aggiornati
23 apr 2017 anni
Indicatori delle variazioni dei valori per anni
In media:
-15.397
Minima:
-26.876
1 gen 1999 anni
Massimo:
-5.09
1 gen 1992 anni
Alla data di osservazione
Valore
Variazione assoluta
La variazione rispetto al valore precedente
1 gen 1992 anni
-5.09
-5.09
0.0%
1 gen 1993 anni
-5.219
-0.129
2.53%
1 gen 1994 anni
-11.055
-5.837
111.84%
1 gen 1995 anni
-15.305
-4.249
38.43%
1 gen 1996 anni
-17.805
-2.5
16.34%
1 gen 1997 anni
-20.091
-2.286
12.84%
1 gen 1998 anni
-20.564
-0.474
2.36%
1 gen 1999 anni
-26.876
-6.312
30.69%
1 gen 2000 anni
-22.253
+4.622
-17.2%
1 gen 2001 anni
-19.892
+2.361
-10.61%
1 gen 2002 anni
-17.663
+2.229
-11.21%
1 gen 2003 anni
-19.17
-1.507
8.53%
1 gen 2004 anni
-17.638
+1.532
-7.99%
1 gen 2005 anni
-15.232
+2.406
-13.64%
1 gen 2006 anni
-10.751
+4.481
-29.42%
1 gen 2007 anni
-10.097
+0.654
-6.08%
1 gen 2008 anni
-16.75
-6.653
65.89%
1 gen 2009 anni
-13.508
+3.242
-19.35%
1 gen 2010 anni
-14.543
-1.034
7.66%
1 gen 2011 anni
-13.939
+0.604
-4.15%
1 gen 2012 anni
-13.078
+0.861
-6.17%
1 gen 2013 anni
-12.217
+0.861
-6.58%
Classificazione dei paesi secondo i statistiche attuali per anni